Physics Practical Graph Examination - Question and Answers 2023
Master plotting, interpreting, and solving physics practical graph questions. Learn techniques for accurate graph creation and slope analysis in this comprehensive tutorial.
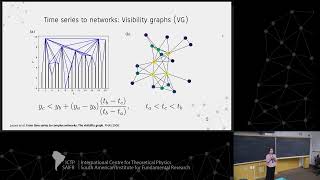
Visibility Graphs for Non-Equilibrium Phase Transitions
Explore visibility graphs for non-equilibrium phase transitions in complex networks with Juliane Teixeira's insightful workshop presentation.
Using the Iowa Environmental Mesonet for Fun and Profit - 2023
Explore the Iowa Environmental Mesonet's applications for meteorology and climate research with expert Daryl Herzmann. Learn to leverage this powerful tool for data analysis and forecasting.
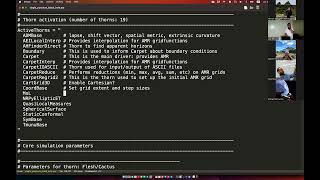
Tutorial on Simulation Analysis
Explore advanced techniques for analyzing gravitational wave simulations, focusing on data interpretation and visualization in computational relativity research.
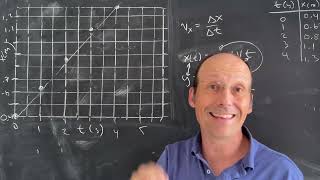
Physics Lab: Using Data to Plot Linear Functions
Learn to create linear graphs for physics labs using Vernier's Graphical Analysis software, enhancing data visualization and analysis skills.
Interactive Analysis of Complex Optical Phenomenon Using Mathematica
Explore interactive Mathematica features for real-time analysis of advanced imaging systems, focusing on polarization effects in AR/VR optics design and visualization techniques.
From Zero to Superset Hero - Data Visualization as Code with Terraform
Master data visualization automation with Terraform and Superset, learning to streamline dashboard creation, metric management, and chart configurations for enhanced efficiency at scale.
One Nova Cluster to Serve Multiple Computing Needs - Managing On-Demand and Dedicated Instances
Discover how San Diego Supercomputer Center efficiently manages a unified nova cluster serving diverse user needs, from on-demand instances to dedicated hosts, using OpenStack, Ceph, and custom Python solutions.
Shinylive - Running R and Python Dashboards Without a Server Using Web Assembly
Master browser-based deployment of R and Python Shiny Dashboards using Web Assembly, eliminating server dependencies while maintaining interactive data visualization capabilities.
Data Analysis in Python - From Descriptive Statistics to Advanced Analytics
Master data analysis fundamentals in Python, from environment setup and data cleaning to advanced statistical methods like T-tests, ANOVA, and regression, with practical business applications and visualization techniques.
Building Reporting Services Using Quarkus and AI
Discover how to leverage LLMs and Quarkus to build innovative reporting services that transform data into meaningful insights, revolutionizing traditional API development approaches.
R Tutorials
Comprehensive R tutorials covering data management, analysis, and visualization, with hands-on exercises using real datasets and practical applications in statistics and data science.
R for Beginners
Comprehensive R tutorials for beginners, covering installation, data manipulation, statistical analysis, and visualization. Hands-on approach with downloadable data files for practical learning.
Streamlit for ML - MUI Card Component Build
Learn to create custom Streamlit components using Material UI design elements, focusing on building an interactive card component for machine learning applications.
The 15 Most Important R Commands - R for Beginners
Learn essential R commands for data manipulation, visualization, and file handling, focusing on dplyr and tidyverse packages in RStudio. Ideal for beginners seeking to enhance their R programming skills.
Predicting Diabetes with Logistic Regression in TensorFlow.js - Deep Learning for JavaScript Hackers
Learn to build and train logistic regression models in TensorFlow.js for diabetes prediction. Covers data visualization, dataset creation, model evaluation, and advanced techniques.
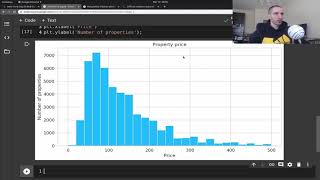
Data Visualization Tutorial for Beginners with Matplotlib in Python - Exploratory Data Analysis
Explore fundamental data visualization techniques using Matplotlib and Seaborn in Python. Learn to create histograms, box plots, violin plots, bar charts, line charts, scatter plots, and more for effective exploratory data analysis.

Python Projects
Learn Python through hands-on projects: build apps, games, and tools while mastering practical programming skills and real-world applications.
Introduction to R Software
Learn R programming essentials: data handling, visualization, statistical functions, and basic calculations. Develop skills for efficient data analysis and manipulation using R software.
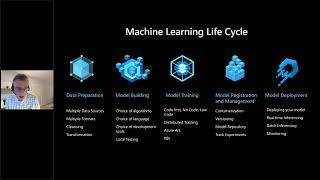
Medical Imaging with Azure Machine Learning
Explore Azure Machine Learning for medical imaging applications, covering data management, model development, deployment, and explainability in healthcare scenarios.
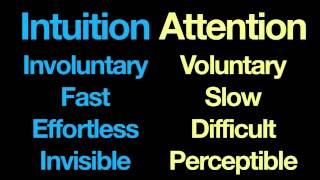
The Programming Ape: Optimizing Software Development for Human Cognition
Exploring human cognition to optimize software development tools, focusing on Yammer's experience in creating human-centric engineering solutions and addressing sociotechnical challenges.