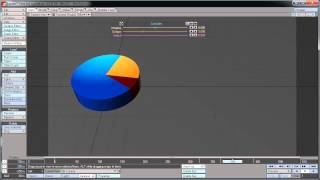
Creating a Dynamic Pie Chart Effect Using Lightwave 3D and Adobe After Effects
Learn to craft dynamic pie chart animations by combining Lightwave 3D's modeling capabilities with After Effects' motion graphics tools for visually compelling data presentations.
Geometric Derivations of RGB Colorspace - The Strange Eyeball Science Messing with Your LEDs
Explore the complexities of RGB colorspace, eyeball science, and LED color fading through geometric derivations and historical colorspace models.
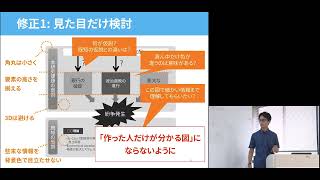
科研費研究計画調書のグラフィックデザイン - チャプター 2
Discover effective techniques for creating impactful figures and graphics in KAKENHI research proposal documents, with practical tips for researchers who find visual presentation challenging.
VarLD- Linkage Disequilibrium Based Selection Signatures - A Comprehensive Tutorial
Comprehensive tutorial on using varLD software for analyzing selection signatures based on linkage disequilibrium, covering prerequisites, data preparation, execution, and result visualization.
Projectile Motion Visualization - Adding Rulers
Enhance projectile motion visualization with rulers, colors, and loops in VPython. Learn to create dynamic physics simulations for better understanding and analysis.
Police Chase Simulation with Obstacles - Episode 7
Explore a physics simulation of a police chase with random obstacles, analyzing motion, probability, and decision-making using Scilab programming.
Bouncy Balls Simulation - Temperature and Pressure Calculations - Episode 5
Explore temperature, pressure, and the Ideal Gas Law through bouncy ball simulations using VPython. Calculate and visualize ensemble properties in this engaging physics coding tutorial.
Importing a Video and Getting Data - Tracker for Beginners Lesson 1
Learn to import videos and generate graphs using Tracker, a video analysis tool for physics exploration. Covers basic processes like creating axes, setting scales, and auto-tracking.
Graph Signal Processing for Neuroimaging - When Anatomy Meets Activity
Explore brain imaging through graph signal processing, connecting anatomy and activity. Learn MRI techniques, brain graphs, and innovative analysis methods for neuroimaging data.
Branes and Quivers in String Theory - Lecture 1
Explore connections between string theory, branes, and quivers. Learn about spatial dimensions, brain setups, Coulomb branches, and moduli spaces in this advanced theoretical physics lecture.
Exercise with Root - Lecture 3
Hands-on ROOT exercise exploring data analysis techniques in high-energy physics, led by expert Tommaso Dorigo. Practical application of statistical methods for particle physics research.
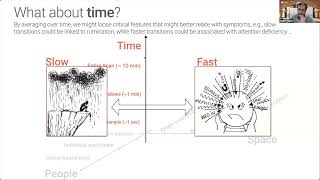
Precision Dynamical Mapping to Characterize Brain Activity Fluctuations
Exploring Topological Data Analysis to map brain activity fluctuations in psychiatric disorders, overcoming neuroimaging limitations and enhancing understanding of neurobiological underpinnings.
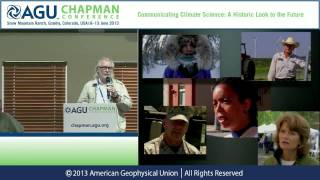
Communicating Climate Science: Innovative Strategies and Social Media Engagement
Innovative climate communication strategies using stories, metaphors, and multimedia to counter misinformation and promote clean energy solutions. Explores effective outreach methods through TV, live events, and social media.
Police Chase - Variable Acceleration - Episode 5
Explore variable acceleration functions to model realistic police officer motion in a chase scenario using Scilab and gnuplot for visualization.
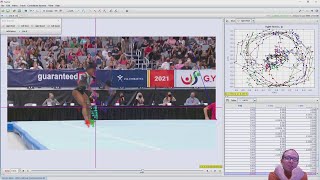
Motion Tracking Simone Biles' Gymnastics Move - Olympics 2021
Analyze Simone Biles' signature gymnastics move using motion tracking software, revealing the intricate dynamics of her hands and feet during Olympic-level performance.
Python Tutorial 3 - Graphing for Computational Physics - Absolute Beginners
Learn to create graphs for computational physics using Python, ideal for undergraduate assignments and beginners in scientific data visualization.
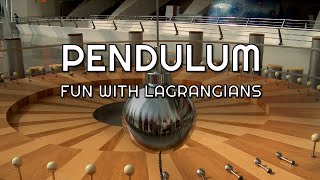
Pendulum Simulation with Jupyter - Fun with Lagrangians - Part 1
Explore pendulum motion using Jupyter and Lagrangian mechanics. Create graphs to visualize equations of motion and gain insights into classical physics analysis.
Rotation-Invariant Web Bases from Hourglass Plabic Graphs and Symmetrized Six-Vertex Configurations
Explore symmetrized six-vertex model, hourglass plabic graphs, and their applications in statistical mechanics and combinatorics. Discover connections to tableaux, alternating sign matrices, and plane partitions.

From Petabytes to Insights - 2023 AGU Informatics Leptoukh Award Lecture
Explore cutting-edge data analysis techniques for transforming massive scientific datasets into actionable insights in Earth and space sciences.
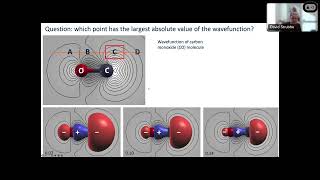
DFT with SIESTA, Data Visualization, and Sophomore-level CURE Using MIT Atomic-Scale Modeling Toolkit
Explore density functional theory, data visualization, and undergraduate research experiences using the MIT Atomic-Scale Modeling Toolkit for modern physics and condensed matter studies.
Kepler - Powering Up the Efficiency of Your Cluster
Explore Kepler, a Kubernetes-based tool for measuring container energy consumption, enabling sustainable cluster management and optimized energy use through metrics and observability.