Field Parameters or Personalize Visuals - Choosing the Right Aircraft for Your Self-Service Journey
Explore dynamic data analysis techniques for self-service reporting, comparing Field Parameters and Personalize Visuals to enhance your data exploration journey.
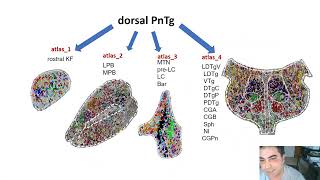
A Spatially-Resolved Transcriptional Atlas of the Murine Dorsal Pontine Tegmentum
Explore a groundbreaking transcriptional atlas of the murine dorsal pontine tegmentum using snRNA-seq and MERFISH, with interactive visualization for real-time data analysis and insights.

Vega Charts with Dyalog: Data Visualization Using Vega-Lite and APL
Explore Vega-lite for data visualization in APL. Learn to create web-ready charts using JSON grammar, HTMLRenderer, and APL data. Covers various chart types and advanced options.
Harnessing Open Source Tools for Cloud-based Geospatial Analysis
Explore open-source tools for cloud-based geospatial analysis using satellite data. Learn to leverage platforms like Google Earth Engine for environmental applications and gain insights into planetary-scale changes.

Применение Grafana Stack для Централизованного Логирования и Трейсинга
Узнайте, как эффективно внедрить Grafana stack для централизованного логирования и трейсинга, включая миграцию с Elastic на Loki и Tempo, масштабирование и решение технических проблем.
Statistics with R Programming Language - Step by Step
Learn statistical concepts and their implementation in R programming. Step-by-step tutorials cover introductory to intermediate topics, with hands-on practice using downloadable datasets and scripts for a comprehensive learning experience.
Descriptive Statistics Concept and With R
Learn descriptive statistics techniques and their implementation in R, covering data summarization, visualization, and basic measures to effectively analyze and present research findings.
Graphs and Descriptive Statistics with R - R Statistical Software Tutorial Videos
Learn to create various graphs and calculate descriptive statistics using R. Master bar charts, boxplots, histograms, scatterplots, and more while customizing plots and adding text and legends.

Introduction to Statistics
Comprehensive overview of basic statistical concepts, including measures of central tendency, data distribution, and graphical representations. Learn to analyze and interpret datasets effectively.
Statistics and Data Analysis
Learn essential statistics and data analysis concepts, including distributions, visualization techniques, correlation, regression, and hypothesis testing, to enhance your data interpretation skills.
Statistics Tutorial with Python - Fundamentals and Data Analysis
Learn Python-based statistics: data types, visualization, measures of central tendency, dispersion, and relationships between variables. Gain practical skills for data analysis.
Topological Strings, Knots, and Quivers - Lecture 1
Explore topological strings, knots, and quivers in this lecture covering knot invariants, Chern-Simons theory, A-polynomials, volume conjectures, and knot homology, with exercises and examples.
The Box Problem: Optimizing Volume in Rectangular Cardboard Boxes - Grades 8-9
Explore volume optimization through 'The Box Problem'. Investigate using models, tables, and graphs. Learn to define variables, write functions, and use graphing calculators for advanced analysis.
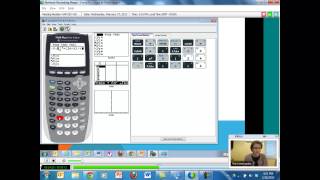
Using Functions to Build Models - Math Teacher Professional Development
Hands-on exploration of mathematical modeling using real-world problems, connecting concepts across Math I to Calculus. Focuses on function creation, domain analysis, and student engagement techniques.
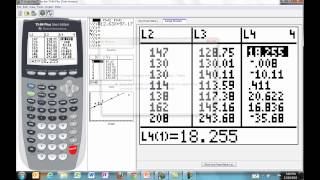
Linear Data Analysis for Math Common Core Standards - Part 3
Explore linear functions for real-world data modeling, focusing on slope and intercept interpretation, linear regression, and residual analysis using interactive tools and practical examples.
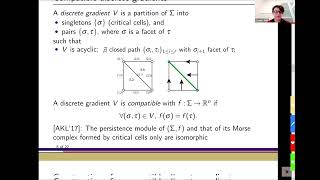
Claudia Landi - Multi-parameter Persistence from the Viewpoint of Discrete Morse Theory
Explore multi-parameter persistence through discrete Morse theory, connecting combinatorial properties of critical cells to algebraic properties of persistence modules in topological data analysis.
Polynomials for Quivers and Topological Recursion
Explore A-polynomials for quivers and their connection to topological recursion in this advanced mathematics lecture by Piotr Sułkowski from the University of Warsaw.
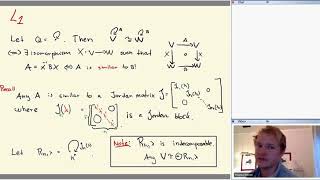
Multidimensional Persistence
Explore multidimensional persistence in algebraic topology, examining advanced concepts and applications in data analysis and shape recognition.
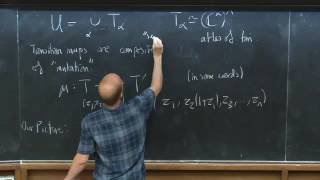
Cluster Algebras and Mirror Symmetry - Lecture 2
Explore connections between cluster algebras and mirror symmetry in algebraic geometry, delving into advanced mathematical concepts and their applications.
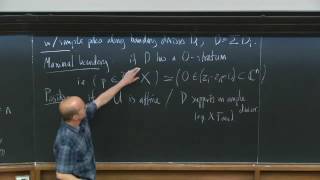
Cluster Algebras and Mirror Symmetry - Lecture 1
Explore the intricate connection between cluster algebras and mirror symmetry in mathematics, delving into advanced concepts and their applications in algebraic geometry.
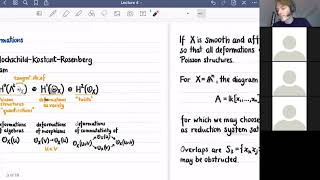
Deformations of Path Algebras of Quivers With Relations
Explore deformation theory of path algebras using reduction systems. Learn about L-infinity algebras, formal deformations, and Poisson structure quantization. Accessible to non-experts with examples.