Streaming Data Enrichment and Analysis with Redpanda, CDC, and Python
Explore real-time data enrichment using streaming platforms, Debezium for CDC, and Python-based ML for sentiment analysis. Learn strategies for data aggregation and visualization in modern streaming architectures.
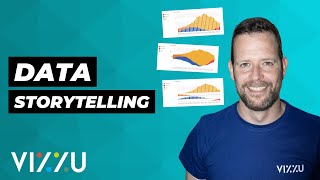
Data Storytelling in Python with Vizzu - Interview with Peter Vidos
Explore data storytelling with Vizzu, a Python tool revolutionizing data visualization. Learn to create impactful charts, animate visualizations, and effectively communicate insights for various audiences.
Building Data Applications on Databricks in 20 Minutes
Learn to create data apps for non-technical users, enabling data-driven decisions. Explore rapid app development using Python frameworks, data access methods, security, governance, and production deployment on Databricks.
Creating Optimized Thematic Portfolios with Bloomberg Enterprise Data
Learn to build custom thematic investing tools using Bloomberg data and Databricks Platform. Explore cloud-based data management, machine learning, and visualization techniques for portfolio optimization.
Deeper BI Integrations with Databricks SQL
Explore advanced BI integrations for Databricks SQL, including seamless connections with Power BI and Tableau, data model syncing, and updates on drivers and connectors.
Enabling Business Self-Service with Lakeview Dashboards
Discover AI-driven Lakeview Dashboards for business analysts. Learn how DatabricksIQ enables natural language chart creation and insight extraction from governed data, empowering teams to interact with data effortlessly.
Introduction to AI/BI Genie - A New Conversational Analytics Experience
Explore best practices for empowering teams with self-service analytics using AI/BI Genie, a conversational tool that enhances data accessibility and reduces workload for data professionals.
Maximizing Productivity with Databricks Assistant - Key Strategies and Tips
Discover how Databricks Assistant enhances productivity through AI-powered code creation, optimization, and troubleshooting. Learn to leverage natural language for SQL, Python, and data visualization while ensuring privacy and security.
Excel Spreadsheet Design Tips and Tricks
Learn advanced Excel techniques to enhance spreadsheet design, improve readability, control data input, add navigation, create summaries, and use forms for quick data entry.
The Ultimate Guide to Notion Charts - 9 Examples
Comprehensive guide to creating and utilizing Notion Charts, covering various types and applications with practical examples and advanced techniques for data visualization.

Introduction to Machine Learning in Computational Biology - Lecture 1
Comprehensive overview of computational biology, exploring GenAI, representation learning, and their applications in genomics and language models. Insights into future directions and potential impacts.
Efficient Spatial Insights - Landmark's Journey with Databricks and CARTO
Explore Landmark's transformation in spatial data analysis using Databricks and CARTO, reducing 10-day processes to 1 hour and enhancing decision-making across departments.

Exploring Datasets with Python and Pandas
Explore datasets using Python and pandas. Learn essential data analysis techniques for scientists, engineers, and analysts working with diverse datasets.
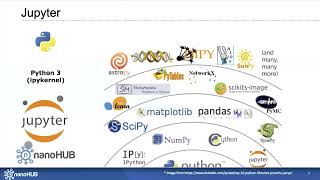
A Guided Tour of Interactive Jupyter Notebooks Powered by nanoHUB
Explore interactive Jupyter Notebooks on nanoHUB. Learn fundamentals, develop code, analyze data, create visualizations, and build GUIs using Jupyter widgets and nanohub-uidl library.
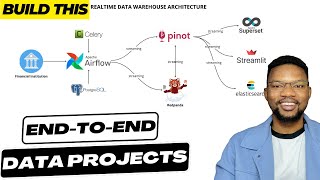
Building Realtime Data Warehouses from Scratch - End-to-End Data Engineering Project
Design and implement a real-time data warehouse with Apache Airflow, Kafka, and Pinot. Create custom hooks, ingest batch and streaming data, and visualize evolving data using Apache Superset.
The Metadata-Driven Data Warehouse
Streamline data warehouse development using metadata-driven approaches. Learn efficient techniques for Insert/Update/Delete operations and pipeline management.
Calculate Evaluation Order in Power BI
Learn practical, visual steps to evaluate CALCULATE expressions with multiple filters/modifiers in Power BI, enhancing your data modeling and visualization skills.
Visualizing Data for Non-Data Experts - Making Reports Accessible to All
Learn to create accessible data visualizations for all audiences. Identify needs, choose appropriate visuals, and present findings clearly and concisely.
Effective Report Design Principles for Power BI
Apply report design principles to enhance Power BI reports as effective communication tools. Learn techniques for creating clear, impactful visualizations that convey insights effectively.
The Future of Data Analytics: Adapting to the Shifting Technology Landscape
Explore Microsoft Fabric's revolutionary impact on data analytics, its key features, and the future trends shaping the technology landscape.
Optimizing DAX Fusion in Power BI
Dive deep into Power BI's DAX engine and learn advanced techniques to optimize DAX fusion for enhanced performance and efficiency.