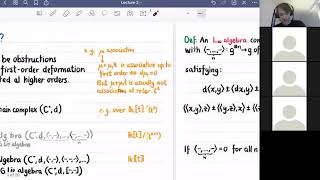
Deformations of Path Algebras of Quivers with Relations
Explore deformation theory of path algebras using reduction systems. Learn to describe all deformations by systematically modifying relations, with applications in representation theory and algebraic geometry.
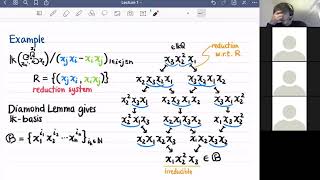
Deformations of Path Algebras of Quivers With Relations - Lecture I
Explore path algebras of quivers with relations in representation theory and algebraic geometry. Learn about deformation theory using reduction systems to systematically deform relations.
Statistics for Data Science
Comprehensive statistics tutorial covering key concepts, distributions, hypothesis testing, and advanced topics for data science applications.
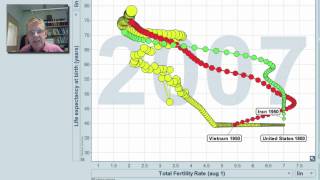
Hans Rosling Answers Top Questions from TED and Reddit Community
Hans Rosling addresses top community questions, offering insights on global health, data visualization, and socioeconomic trends in an engaging 18-minute interview with TED and Reddit.
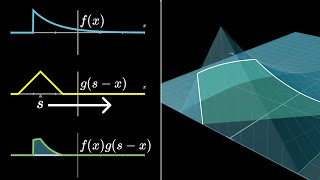
Convolutions and Adding Random Variables, Visually Explained
Visual explanation of convolutions and adding random variables, exploring discrete and continuous cases, with connections to the central limit theorem and practical examples.
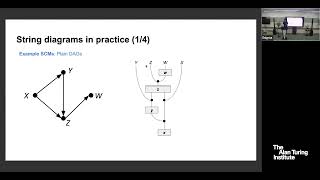
String Diagrams for Structural Causal Modeling and Inference
Explore structural causal modelling and inference using string diagrams, a powerful visual tool for understanding complex causal relationships in data analysis.
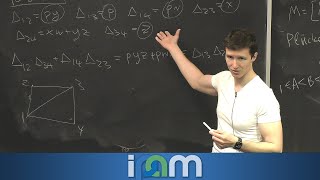
Introduction to Cluster Algebras - Part 1
Explore cluster algebras, quivers, and mutation through examples, with a focus on the Grassmannian. Gain insights into this fundamental algebraic structure and its applications.
Symmetric Functions: Foundations and Applications in Combinatorics - Part 1
Explore symmetric functions in algebraic combinatorics, representation theory, and statistical mechanics. Learn formulas, combinatorial models, and key properties with applications and open problems.
Symmetric Functions: Formulas, Combinatorial Models, and Applications - Part 2
Explore advanced concepts in symmetric functions, their applications in combinatorics and representation theory, and their role in statistical mechanics as partition functions.
Logarithms: Applications in Mobile Technology, Pandemic Modeling, and Social Networks
Explore logarithms' relevance in modern life, from pandemic modeling to information theory and social networks. Discover their history and applications in this insightful lecture by Professor Oliver Johnson.
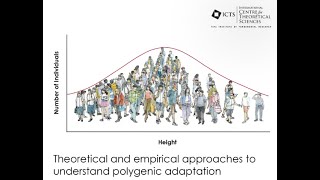
Tools of High Dimensional Data - Lecture 3
Explore high-dimensional data analysis techniques with Bruce Walsh, focusing on advanced tools and methods for complex datasets in biological evolution and genetics.
Statistics for Data Science with Gen AI and ChatGPT - Full Course (2024)
Master essential statistical concepts and techniques for data science, including descriptive analysis, correlation, regression, and leveraging AI tools for advanced insights.

Introduction to Variance - Exploring with Technology (Part 1 of 3)
Explore variance concepts using technology in this engaging tutorial, enhancing understanding of statistical dispersion and data analysis techniques.
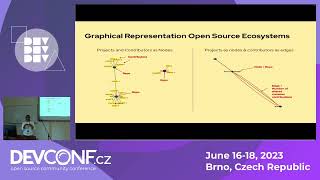
Uncovering New Open Source Communities Graphically
Explore graph theory techniques to visualize and analyze open source ecosystems, uncovering emerging communities and their relationships to established projects.
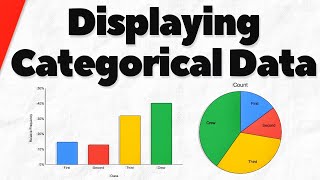
Bar Charts and Pie Charts for Categorical Data in Statistics
Learn to create and interpret bar charts and pie charts for categorical data, exploring frequency tables and comparing visualization methods.
Beyond the Basics of Graphs and Networks
Explore advanced concepts in graph theory and network analysis, delving into complex structures and algorithms for deeper insights into interconnected systems.
Nutrients by the Numbers - Statistical Analysis of Food and Nutrient Data
Explore statistical analysis of food and nutrient data relationships, visualize distributions through informative plots and histograms with Gay Wilson.

Graph Your Game: Strategic Playbooks Unveiled - Mapping Lacrosse Tactics
Explore strategic playbooks in lacrosse using graph theory and Golang. Learn to visualize player and team dynamics, implement knowledge graphs, and leverage CypherQL for data analysis.
Introduction to Linear Algebra for Data Science
Explore core linear algebra concepts in data science, from vector representations to matrix factorization, with real-world applications in text similarity, image processing, and content recommendation.
Introduction to Statistics - Key Concepts and Applications
Learn fundamental statistical concepts, data types, and key terms. Explore data summarization, visualization techniques, and real-world applications in this comprehensive introduction to statistics.
Progress in Graphs and Networks
Explore advancements in graph theory and network analysis, uncovering applications in various fields and enhancing problem-solving skills.