
Education and Science Communication Through Visualization
Discover how global experiences shape innovative teaching in data visualization, blending theory and practice to inspire students and foster creativity in science communication.
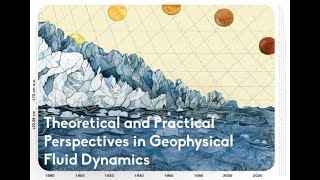
Visualization with Python Tutorial
Learn Python visualization techniques for geophysical fluid dynamics, covering data representation and analysis tools essential for atmospheric and oceanic research.

Excel Introduction to Data Analysis Tutorial
Learn essential Excel data analysis techniques: formatting, conditional functions, charting, and Pivot Tables. Gain skills to summarize, visualize, and extract insights from your data effectively.

Browser-Based Load Testing with Grafana K6 for Front-End Performance Optimization
Enhance front-end performance through browser-based load testing using Grafana and K6. Learn integration strategies, optimization techniques, and best practices for web applications.

Introduction to Azure Databricks
Explore Azure Databricks: Simplify big data analytics, streamline processing, and enhance data accessibility for informed decision-making.

Monitoring Tools with Grafana
Explore Grafana's powerful data visualization and monitoring capabilities for effective metric analysis and alerting across diverse data sources.
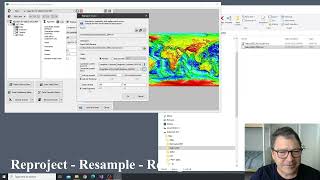
Introducing the Processing Menu in ProRaster Scientific
Discover new Raster Processing operations in ProRaster Scientific, enabling immediate visualization of huge raster outputs without execution. Learn export, statistics, join, clip, mask creation, reprojection, and more.
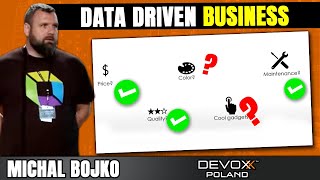
Data Driven Business
Discover strategies for leveraging data to drive business decisions and optimize performance in today's data-centric landscape.

Detecting Power Laws in Real-world Data with Python Code
Learn to detect power laws in real-world data using Python, covering log-log and maximum likelihood approaches with practical examples using artificial and social media datasets.
Visualizing Patient Safety - Using Tableau to Analyze Fall Events
Explore Tableau for patient safety analysis, focusing on fall events visualization and data-driven insights in healthcare settings.
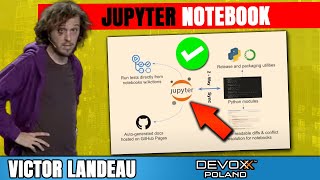
Jupyter Notebook vs Classical IDEs - Do You Have to Choose?
Explore the strengths and limitations of Jupyter Notebooks and traditional IDEs, understanding when to use each for optimal coding efficiency and productivity.
Visual Data Analytics - A Short Tutorial
Explore visual data analytics techniques for large datasets, bridging data mining and HCI to solve real-world problems with scalable interactive tools.
Dataset Cartography: What Capital One Monitors to Better Manage AI Training Data
Explore dataset cartography techniques used by Capital One to enhance AI training data management and improve model performance.
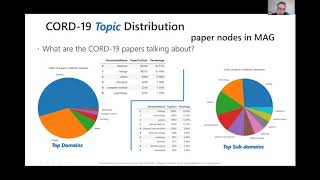
Knowledge Graph Recommendation Systems for COVID-19
Explore knowledge graph recommendation systems for COVID-19, leveraging Python skills to enhance understanding of pandemic-related data and insights.

The Algorithm is Not Enough: UX Meets Data Science
Explore the synergy between UX and data science, learning how to integrate user-centric design with data-driven insights for more effective product development.
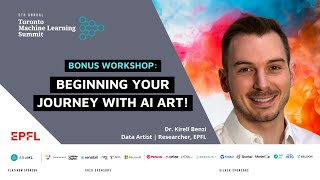
Beginning Your Journey with AI Art
Explore AI art creation using accessible tools and visual programming. Learn dataset manipulation and Cables.gl basics for innovative designs in motion graphics and data visualization.
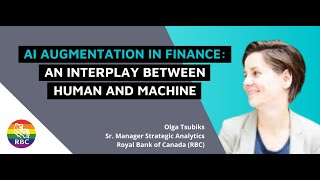
AI Augmentation in Finance - An Interplay Between Human and Machine
Explore AI augmentation in finance, enabling decision-makers to extract key insights from complex data for effective decision-making and trend identification.
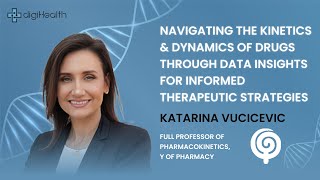
Data-Driven Insights for Drug Kinetics and Dynamics in Therapeutic Strategies
Explore how data-driven approaches and advanced statistical methods optimize drug behavior analysis and therapeutic strategies for personalized healthcare outcomes and improved treatment effectiveness.

Data Radar Maps: Navigating Product Growth with Data Insight
Discover how Data Radar Maps and data-informed models drive product growth through real-world case studies and practical insights for product teams seeking data-driven success.

Excel Tips and Tricks - 10 Time-Saving Tutorials for Beginners and Intermediate Users
Learn 10 time-saving Excel techniques, from inserting hyperlinks to creating gauge charts. Enhance productivity with step-by-step tutorials suitable for beginners and intermediate users alike.

Building an AI Assistant for BI - The Good, the Bad, and the Ugly
Explore challenges and lessons learned in developing AI-powered assistants for data visualization, addressing unique issues in business intelligence workflows and data exploration.