PowerPoint 365 for Beginners - Comprehensive 4-Hour Tutorial
Comprehensive tutorial covering PowerPoint 365 essentials and advanced techniques, from interface basics to AI features, enabling creation of professional presentations with engaging design and efficient workflows.

Discrete Morse Graph Skeletonization and Application to Local Structures of scRNA-seq Data
Explores topological data analysis for extracting graph skeletons from high-dimensional data, with applications in analyzing local structures of scRNA-seq datasets across brain regions.
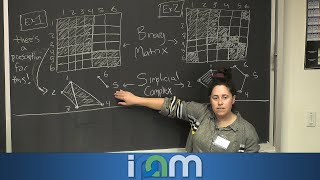
The ABCs of Topological Data Analysis for Matrix Analysis
Explore topological data analysis for matrix structure, focusing on persistent homology and Betti curves. Learn applications in neuroscience, including analysis of neural correlation matrices.

Tableau Business Intelligence Master Tutorial - Advanced Dashboard Design and Analytics
Master Tableau for business intelligence: create interactive dashboards, custom reports, and insightful visualizations. Learn best practices, innovative techniques, and real-world applications to elevate your data analysis skills.

30 Essential Excel Tips and Tricks for Productivity - 2024 Tutorial
Comprehensive Excel tutorial covering 30 essential tips and tricks, from basic functions to advanced data visualization techniques, enhancing productivity and efficiency for users of all levels.

Artificial Intelligence Can Help Us to Be More Human
Explore how AI-generated artwork can foster empathy, transform dialogue, and bridge divisions in our increasingly divided world through Dr. Ginger Carlson's compelling blend of personal experience and technological potential.

From AI to GX: The Quantum Leap in Algorithmic Evolution
Explore the evolution from AI to Generative Algorithms (GX) and its impact on algorithm design, creativity, and innovation in technology and society with insights from industry expert Jepson Taylor.

Tableau Business Intelligence - Full Course Tutorial
Comprehensive Tableau tutorial covering diverse business scenarios, from personal finance to global data analysis. Learn to create interactive dashboards and gain practical BI skills through hands-on projects.
Tableau Data Visualization Beginner Tutorial
Learn to connect data sources, create various charts, and master essential Tableau features for powerful data visualization and analysis.
Tableau Data Visualization Advanced Tutorial
Master advanced Tableau techniques: data manipulation, customization, exporting, and interactive visualizations for powerful data storytelling and analysis.

Excel for Finance and Accounting - Full Course Tutorial
Comprehensive Excel tutorial for finance professionals, covering functions, charts, and real-world applications. Learn to create financial statements, analyze data, and improve workflow efficiency.

Staring into the Abyss and Eating Glass - From Academia to Startup
Explore the journey from academia to entrepreneurship with insights on building a sports analytics startup. Gain valuable perspectives on challenges, similarities, and differences between academic and business worlds.

Visualizing and Analyzing Event Sequence Data
Explore techniques for analyzing event sequence data, including causal inference, deep learning, and generative AI, to extract valuable insights from high-dimensional business process data.
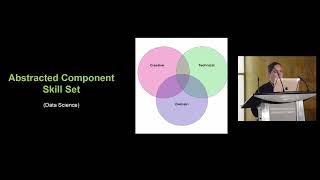
Data Storytelling for Beginners
Explore effective data storytelling techniques, blending math, science, art, and communication, with real-world examples from Shopify's practices.

PyScript for Data Science: Writing Python in the Browser
Explore PyScript's potential for data scientists to write Python in browsers, revolutionizing web development and enhancing data science workflows.

My Story as a Data Visualization Freelancer - Ups, Downs, and Lessons Learned
Discover the journey of a data visualization freelancer, exploring challenges, motivations, and valuable insights for success in the field.

How to Get Noticed for a Power BI Job Interview
Stand out in Power BI job interviews with a simple yet effective trick to showcase your report creation skills, even without extensive experience.
Report Design and Psychology - Quick Tips
Learn intuitive report design techniques based on how the brain processes information, enhancing data visualization and communication effectiveness.
Visualizing Large Greenhouse Gas Datasets in the Browser with DECK.GL
Explore techniques for visualizing large greenhouse gas datasets using DECK.GL, enabling effective climate change analysis and emission source identification in web browsers.
Project Analysis Day 1: Finding Your Project in a Jumble of Data
Explore approaches for identifying and measuring project health across diverse data sources, addressing challenges in standardizing analysis for varied project types.

Excel Data Analysis Full Course Tutorial
Comprehensive tutorial covering advanced Excel features for data analysis, including Pivot Tables, XLOOKUP, Copilot integration, VBA, and macros. Master powerful tools to enhance your data manipulation skills.