Tableau Business Intelligence - Beginner Tutorial for Dashboard Creation
Learn to create insightful Tableau dashboards with interactive visualizations, custom reports, and data analysis techniques for real-world business scenarios and effective decision-making.

Excel Ninja Skills - 10 Essential Tips and Tricks for Beginners
Learn essential Excel skills including Venn diagrams, funnel charts, cell counting, find and replace, merging cells, formula conversion, random lists, cell styles, and page numbering in this comprehensive tutorial.
Tableau Business Intelligence - Intermediate Techniques and Dashboard Design
Elevate your Tableau skills with advanced techniques for creating insightful dashboards. Learn to analyze data, visualize trends, and apply cluster analysis to real-world business scenarios.
National Climate Assessment Atlas: A Powerful New Climate Reporting Tool
Explore the NCA Atlas, a powerful interactive tool for journalists to access localized climate data, projections, and visualizations from the 5th National Climate Assessment for enhanced reporting on climate issues.
Re-interpreting Data - Turning Files into Audio, Images, and Music
Explore unconventional data transformations using Ruby, turning files into audio, images, and music. Learn byte manipulation techniques while discovering creative ways to represent information.
The Mentoring Effect: Measuring Effectiveness of LFX Mentoring Programs
Explore the impact of CNCF LFX mentoring programs on open source contributions, career development, and project sustainability through data-driven insights and interactive dashboards.

Data Cubes in Hand: A Design Space of Tangible Cubes for Visualizing 3D Spatio-Temporal Data in Mixed Reality
Explore tangible cubes for visualizing 3D spatio-temporal data in mixed reality. Discover innovative interaction techniques and design spaces for intuitive data exploration and visualization.
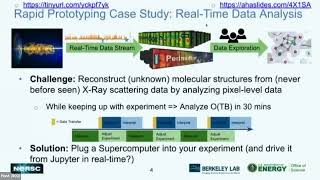
Data Science with Julia - Hands-on Tutorial
Hands-on tutorial exploring Julia for data science, covering interactive analysis, visualization, and machine learning algorithms. Equips participants to apply Julia in their own projects.
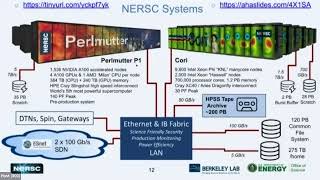
Julia for Python Programmers
Hands-on introduction to Julia for scientific computing and data science, focusing on its efficiency and interactive capabilities for technical applications and scalable computing.

Excel Copilot Tutorial - Boosting Productivity with Microsoft's AI Assistant
Learn to leverage Microsoft Copilot in Excel for data analysis, visualization, and task automation. Boost productivity with AI-powered insights, formulas, and problem-solving capabilities.
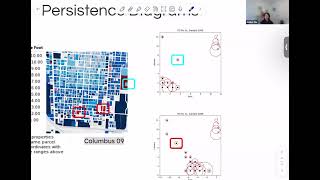
Topological Data Analysis in Economic Context - Property Tax Maps
Exploring property tax patterns using topological data analysis to classify housing structures and regional demographics, offering new insights into community organization and economic indicators.

Excel Full Course Tutorial - From Basics to Advanced (4+ Hours)
Comprehensive Excel tutorial covering basics to advanced features, including formulas, data analysis, pivot tables, charts, and VBA macros for improved productivity and data management skills.
PivotTables for Quick and Easy Reports - 34 Advanced Techniques
Master PivotTables with 34 advanced techniques for efficient data analysis and reporting. Learn to handle large datasets, create custom calculations, and generate insightful visualizations in Excel.
Data Science: The Bear Necessities - Exploring Koala Data with Python and Pandas
Explore koala data using Python, Pandas, and Matplotlib to create informative visualizations and gain insights into protecting these endangered Australian icons.
Simplifying Data Analysis and Visualization with Developer Tools and AI
Explore data analysis and visualization using AI-assisted tools. Learn to leverage GitHub, Jupyter, Copilot, and LIDA for efficient insights and visualizations, even without extensive Python experience.

Interactive Session on Data Analysis - Lecture 2
Hands-on data analysis session exploring techniques and tools for probing hadron structure at the Electron-Ion Collider, emphasizing practical skills and real-world applications.
Graphing Zephyr Development and Project Health - How Visualizing Data Helps with Growth and Scaling
Explore how data visualization and metrics tracking drive growth and scaling in the Zephyr project, addressing challenges and identifying trends for improved project health.
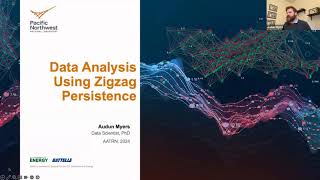
Data Analysis Using Zigzag Persistence for Temporal Hypergraphs
Explore temporal hypergraphs and zigzag persistence in Topological Data Analysis to understand complex systems' evolution, with applications in cybersecurity and social networks.

Excel for Finance and Accounting: Expert Tutorial
Master Excel for finance: NPV, IRR, charts, Pivot Tables. Create income statements, balance sheets, cash flow statements. Practical exercises for real-world financial data analysis and presentation.

Data Science: Complete Roadmap to Become a Data Scientist
Comprehensive roadmap to becoming a data scientist, covering essential skills, tools, and resources. Includes job prospects, learning strategies, and recommended books for career advancement.

Excel Advanced Tutorial - From Named Ranges to VBA
Master advanced Excel techniques: named ranges, XLOOKUP, database functions, macros, and VBA coding. Enhance data analysis, automate tasks, and create efficient spreadsheets for improved productivity.