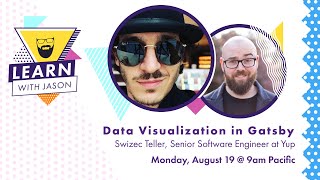
Data Visualization in React Using Gatsby - Learn With Jason
Learn to create SSR-friendly data visualizations using D3, React, and Gatsby for high-performance progressive web apps. Explore techniques for building interactive and efficient dataviz components.

Introduction to Grafana - Data Visualization and Analytics
Learn to install, configure, and use Grafana for data visualization and analytics. Explore metrics, build dashboards, set up alerts, and import community dashboards in this comprehensive introduction.
Tableau Basics Advanced Tutorial
Aprenda a criar visualizações avançadas, dashboards interativos e histórias de dados eficazes no Tableau. Domine técnicas de formatação, análise aprofundada e previsão para elevar suas habilidades de análise e visualização de dados.

Visio 2021 Full Course Tutorial
Comprehensive tutorial on Visio 2021, covering interface navigation, diagram creation, advanced features like 3D shapes, and integration with external sources. Suitable for beginners and intermediate users.

Tableau Basics Expert Tutorial
Master Tableau essentials: data preparation, advanced visualization techniques, and effective storytelling. Learn to create interactive dashboards, use calculations, and share insights professionally.
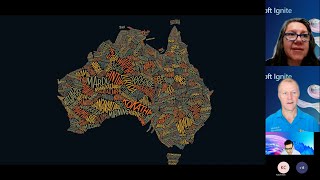
Overview of the Planetary Computer and Measuring Corporate Sustainability Progress
Explore satellite imagery with the Planetary Computer and learn to manage corporate carbon budgets. Gain insights into global sustainability initiatives and stakeholder perspectives.

Drive a Data Culture with Power BI: Vision, Strategy, and Roadmap
Discover how Power BI drives data culture, leveraging AI for pattern recognition and seamless integration with Teams and Excel for enhanced collaboration and data analysis capabilities.

Drive a Data Culture with Power BI: Vision, Strategy, and Roadmap
Discover Power BI's vision and roadmap for driving data culture. Learn about AI-powered insights, collaboration features in Teams and Excel, and integration with Synapse for advanced analytics.
Drive a Data Culture with Power BI and Microsoft Teams
Discover how Power BI and Microsoft Teams integrate to enhance data-driven decision-making, enabling easy access to insights, collaborative analysis, and fostering a data-centric culture in connected workplaces.
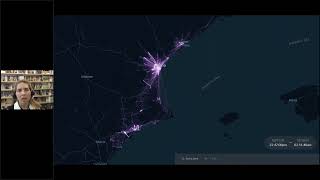
Data Science Against COVID-19 - Nuria Oliver, PhD
Explore how data science combats COVID-19 through mobility models, epidemiological predictions, and large-scale surveys. Learn key technical skills and insights from Dr. Nuria Oliver's multidisciplinary team of volunteer scientists.
Automatic Cell-Annotation for Single-Cell RNA-Seq Data Using a Reference Dataset - A SingleR Tutorial
Learn to annotate cell types in single-cell RNA-Seq data using SingleR. Explore annotation strategies, reference datasets, and diagnostic tools for accurate cell type assignment and visualization.

Tableau Basics Beginner Tutorial
Comprehensive introduction to Tableau for data analysis and visualization. Learn to create visualizations, work with data sources, build dashboards, and apply advanced techniques for effective data storytelling.
Tableau Data Visualization Expert Tutorial
Master Tableau's data visualization tools: from basics to advanced techniques. Learn to create interactive dashboards, custom reports, and powerful visualizations for effective data analysis and presentation.
Visualization Techniques for Data Analysis - Session 20
Explore data visualization techniques and best practices for effectively communicating complex information through visual representations.
Tools and Techniques - Data Science with R - Dr. James Geddes
Explore data science techniques using R with Dr James Geddes. Learn practical skills for analyzing and visualizing data from an expert at the Alan Turing Institute.
Data, Meet Design - Making Information Beautiful
Explore how visual arts enhance informed debate on significant issues, focusing on Herbert Bayer's World Geo-Graphic Atlas as a precursor to modern information design.

Hands-On Workshop: Getting Started with Fluent Bit and Metrics with M3DB
Hands-on workshop exploring Fluent Bit's new metrics capabilities with M3DB. Learn to collect, send, and visualize metrics using open-source tools in a cloud-native observability stack.
The New Real Observatory - Bridging Climate Data and Art through AI
Unveiling an interactive climate AI platform for artists, bridging global datasets with local perspectives. Explore transformative ideas through art and AI to address climate change and foster a thriving planet.
Communicating Complex Data with Model Driven Journalism
Explore innovative approaches to bridge the gap between data science capabilities and public trust in statistics, focusing on making data-driven reporting more accessible and relevant for decision-making.
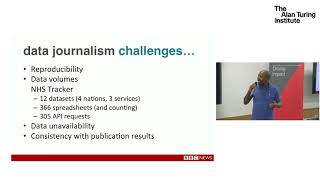
Data Science and Data Journalism Projects
Exploring data science in journalism: challenges, opportunities, and ethical considerations for leveraging public data to enhance reporting and foster critical thinking in the post-truth era.
Community Data is Not Community Metrics - Measuring Community Health
Explore the importance of asking the right questions when analyzing community health metrics, moving beyond raw data to gain meaningful insights for open source projects.