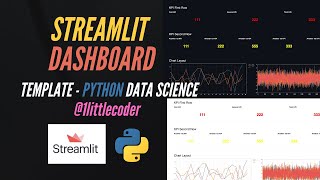
Build Streamlit Dashboard Template for Python Data Science
Learn to build interactive data science dashboards using Streamlit in Python, covering layout design, data visualization, and customization techniques for creating professional-looking web applications.
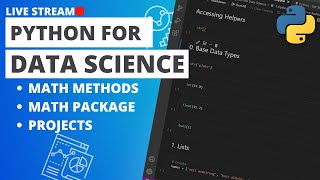
Python for Data Science - Doing Math with Python
Learn essential math operations in Python for data science, including multiplication and exponents, using Jupyter Notebooks as a powerful computational tool.
Intro to Plotly Express - Complex Interactive Charts with One Line of Python Code
Create interactive data visualizations, including the Gapminder Animation, using Plotly Express in Python with minimal code. Learn to build and enhance plots step-by-step for effective storytelling.
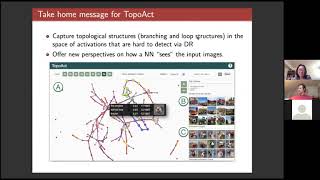
TopoAct - Visually Exploring the Shape of Activations in Deep Learning
Explore the shape of neuron activations in deep learning using topological data analysis. Gain insights into learned representations of image classifiers with TopoAct visualization system.
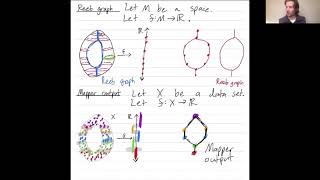
The Mapper Algorithm and Reeb Graphs
Explore the mapper algorithm in applied topology, its connection to Reeb graphs, and its application to high-dimensional data analysis and 3D object recognition.
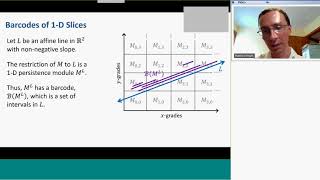
Visualizing 2 Dimensional Persistent Homology
Explore techniques for visualizing 2D persistent homology, a powerful tool in topological data analysis, to gain insights into complex datasets and their underlying structures.

Python for Data Science
Comprehensive guide to mastering Numpy, Pandas, and Plotly for data science in Python. Covers core concepts and practical applications with free, commented code files for hands-on learning.
Tableau Basics Full Course Tutorial
Comprehensive Tableau training covering fundamentals to advanced techniques. Learn data visualization, calculations, formatting, storytelling, and sharing insights using Tableau's powerful features.
Microsoft Excel Ultimate Chart Tutorial - 10 of the Most Useful Chart Types Explained
Learn to create and use 10 essential Excel chart types, from histograms to pie charts, with step-by-step guidance for beginners and intermediate users.

Introducing Weave and Production Monitoring
Explore Weave and Production Monitoring features for enhanced model training and productionization. Learn about Weave's ecosystem, composition capabilities, and the new Production Monitoring tool for improved AI/ML workflows.

Google Slides Tutorial
Comprehensive tutorial on creating engaging presentations with Google Slides, covering basics to advanced features like slide masters, animations, and data integration for effective visual communication.
Tableau Basics Intermediate Tutorial
Comprehensive tutorial on advanced Tableau techniques, covering visualizations, calculations, and table manipulations for effective data analysis and storytelling.
Data Visualization in Python - Altair Scales, Axes, and Legends - Lecture 4
Master Altair's scales, axes, and legends for effective data visualization in Python. Learn to customize charts, enhance readability, and extract insights using advanced techniques and color encoding.
Data Visualization in Python - Altair Data Preparation Techniques
Explore data preparation techniques in Altair for effective visualization, including aggregation, binning, time unit transforms, and filtering to shape and analyze your data effectively.
Data Visualization in Python - Building Blocks of Altair - Tutorial Series Part 2
Explore Altair's fundamental components for data visualization in Python, including data types, graphical marks, and visual encoding channels. Learn to create interactive and customizable charts.
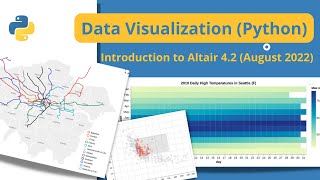
Data Visualization in Python - Altair 4.2 Tutorial
Comprehensive tutorial on Altair for data visualization in Python, covering setup, basic plots, customization, interactivity, and advanced features. Ideal for beginners and intermediate users.
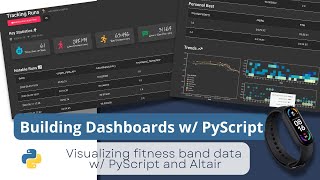
Building Dashboards with PyScript and Altair - Part 1
Learn to build interactive dashboards using PyScript, Altair, and Pandas. Create visually appealing data visualizations from fitness tracker data with step-by-step guidance on data processing and chart customization.
YouTube Analytics and Data API with Python - May 2022 Update
Learn to use YouTube Analytics and Data APIs with Python, covering setup, authentication, data retrieval, and creating CLI tables. Gain practical skills for working with Google's latest API libraries.
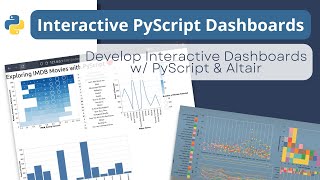
Building an Interactive Dashboard with PyScript and Altair - Tutorial 3
Learn to create an interactive dashboard using PyScript and Altair, from setup to deployment. Covers importing dependencies, building visualizations, and deploying the final product on GitHub Pages.
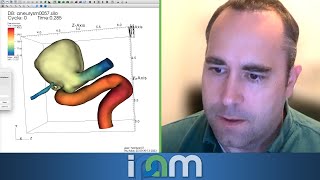
Visualization and Analysis of HPC Simulation Data with VisIt
Explore HPC simulation data visualization using VisIt software, focusing on techniques for analyzing large-scale scientific datasets in high-performance computing environments.
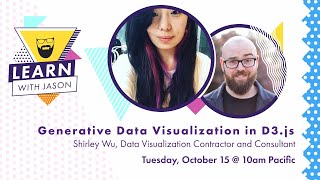
Generative Data Visualization - Learn With Jason
Explore data visualization techniques with artist Shirley Wu, learning to transform complex data into stunning, understandable designs through sketching, analysis, and creative approaches.