
The Importance of Information Presentation in Healthcare
Passionate exploration of how effective information presentation in healthcare can empower patients and improve outcomes, with insights from Wired Magazine's executive editor.
Getting Started with Tableau Dashboard
Learn Tableau Dashboard fundamentals, including data visualization, architecture, and interactive features. Hands-on demonstrations cover installation, data types, and creating worksheets for effective business intelligence analysis.

Learn Python Step by Step - Python Tutorial for Beginners
Comprehensive introduction to Python programming, covering fundamentals, data structures, and popular libraries. Ideal for beginners seeking a structured approach to learning this versatile language.
IPL Data Analysis Using EDA - Exploratory Data Analysis Case Study
Practical guide to IPL data analysis using Python, covering EDA techniques, data preprocessing, and visualization to extract insights from real-world cricket datasets.
Exploratory Data Analysis Tutorial - Basics of EDA with Python
Learn Python-based exploratory data analysis techniques to uncover insights, detect patterns, and visualize relationships in datasets for informed decision-making and hypothesis testing.
Excel Basics for Beginners - MS Excel
Master Excel basics: formulas, data manipulation, and visualization. Learn essential skills for spreadsheet analysis and effective data presentation in this comprehensive beginner's guide.

Top 10 Indian Foods Analysis Using Python
Analyze top Indian foods using Python, covering data manipulation, visualization, and machine learning. Learn pandas, NumPy, Matplotlib, Seaborn, and scikit-learn for exploratory data analysis on Indian cuisine dataset.
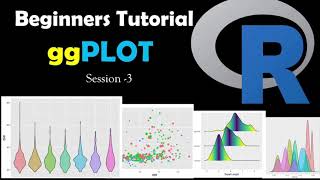
Graph ggPLOT Beginner Tutorial - Creating Simple Graphs in R
Learn to create simple graphs using ggplot2 in R, enhancing your data visualization skills for effective analysis and presentation.
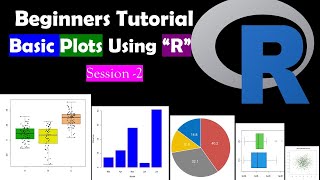
Creating Simple Graphs in R Studio - Bar, Scatter, and Box Plots
Learn to create bar graphs, scatter plots, pie charts, and box plots using simple R functions for effective data visualization in RStudio.
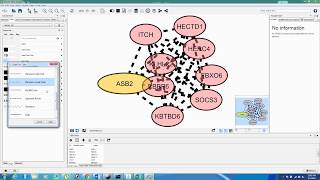
Identification of Nodes and Edges in Cluster Finder - CFinder and Clique Percolation Method
Explore k-clique communities in networks using CFinder's Clique Percolation Method algorithm for effective subgraph analysis and community detection.
FLORAH - Planting Better Merger Trees with Deep Generative Models - Tri Nguyen (MIT)
Explore deep generative models for improved merger tree creation in galaxy formation studies, enhancing our understanding of cosmic structure evolution and linking observations with theoretical models.
Excel Formulas and Functions - Excel for Beginners
Learn essential Excel formulas and functions for data analysis and visualization. Master basic operations, conditional functions, and data manipulation techniques to enhance your spreadsheet skills.
Tableau vs Power BI - Best BI Tool - PowerBi & Tableau Difference
Comparative analysis of Tableau and Power BI, exploring key features, data handling, user experience, and purposes to help professionals choose the best business intelligence tool.
Exploratory Data Analysis with Binance API Using Python and Pandas - MLTrader Episode 1
Learn to extract and analyze real-time crypto data from Binance using Python and Pandas. Covers API setup, data pulling, exploratory analysis, and candlestick visualization with MPLFinance.

Pandas for Data Science - Python Crash Course
Learn essential Pandas skills for data science quickly. Create, update, visualize, and preprocess data frames from various sources, then output to CSV, JSON, and HTML formats.
Analyzing Twitter Accounts with Python and Personality Insights
Learn to analyze Twitter accounts using Python, Tweepy, and Watson Personality Insights. Create visualizations with Seaborn and Matplotlib to profile Twitter users and gain insights into their personalities.
Excel to Simple Web Dashboard in R with FlexDashboard and Hosting on Hugging Face Spaces
Learn to create a simple web dashboard in R using FlexDashboard, transforming Excel data into an interactive visualization, and deploy it on Hugging Face Spaces for easy sharing and accessibility.
Real-Time Live Dashboard in Python Using Streamlit - Tutorial
Create a dynamic data science dashboard using Streamlit, featuring real-time updates for finance, marketing, or system monitoring. Learn key Streamlit components and Plotly Express charts integration.
Amazon SageMaker Studio Lab Tutorial - Google Colab Alternative
Learn to use Amazon SageMaker Studio Lab, a free tool for machine learning and data science with Jupyter notebooks, Python, R, and GPU support. Explore its features and advantages over alternatives.
Data Storytelling with ComicStrips - Using ComicGen and Google Sheets
Create engaging data comic strips using Gramener's ComicGen and Google Sheets, enhancing your storytelling skills with visual narratives.
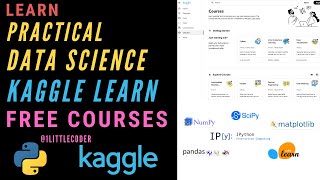
How to Become a Practical Data Scientist with Kaggle Learn
Discover a comprehensive, free path to becoming a practical data scientist using Kaggle Learn's step-by-step courses, covering Python, machine learning, data visualization, and more.