
Clustering and Markers Identification for ScRNA-Seq - Seurat Package Tutorial
Learn to analyze single-cell RNA-seq data using Seurat package, covering data import, QC, normalization, clustering, and marker identification. Gain insights into cell interactions and create visualizations.

Visual Data Analysis - How, When, and Why
Explore visual data analysis with experts, discussing its benefits, applications, and effective interface design for complex decision-making in various fields.

Built for Profit, Repurposed for Research - Using Advertising APIs to Collect Social Media Data
Explore innovative methods for collecting social media data using advertising APIs, focusing on Facebook's audience estimates for research in migration, poverty mapping, and digital gender gaps.
Koalas - Scaling Pandas API on Apache Spark
Learn to scale pandas operations to big data using Koalas, an open-source project implementing the pandas API on Apache Spark. Transition seamlessly from single-machine to distributed environments for large-scale data science.
Faster Data Integration Pipeline Execution Using Spark-Jobserver
Optimize data integration pipelines using Spark-Jobserver for faster execution, context reuse, and efficient resource management. Learn configuration, security, and API integration for improved performance.
Time Series Analysis Visualizations with Matplotlib, Seaborn, and Plotly
Explore time series visualization techniques using Matplotlib, Seaborn, and Plotly. Learn to style charts and analyze trends, seasonality, and moving averages in data science applications.

Testing Stock Trading Strategies with Ichimoku Analysis
Learn to test stock trading strategies using Python, focusing on Ichimoku analysis with real-time data, customizable charts, and performance evaluation techniques.
Getting Started with Technical Analysis 2 - Bollinger Bands and Advanced Indicators
Learn advanced technical analysis techniques including Bollinger Bands, moving averages, support/resistance lines, and candlestick patterns using Python and data science libraries for stock market analysis.
Technical Analysis - Ichimoku Indicator Tutorial
Learn to use the Ichimoku indicator for comprehensive technical analysis, covering momentum, support, and resistance through its 5 lines. Gain insights into 11 analysis methods using Python and real-time data visualization.

Technical Analysis: RSI and Bollinger Bands Using Python
Learn to perform technical analysis using Python, focusing on RSI and Bollinger Bands. Create customizable charts with real-time data for stock market predictions using various data science libraries.
Technical Analysis: MACD and Stochastic Oscillator Using Python
Learn to use Python for stock market technical analysis, focusing on MACD and Stochastic Oscillator. Covers data retrieval, chart creation, and multiple technical indicators using various data science libraries.
Technical Analysis with Python for Stock Market Predictions
Learn Python-based technical analysis for stock market predictions, covering data retrieval, chart patterns, moving averages, and advanced visualization techniques using data science libraries.

Python for Data Science - Mastering NumPy, Pandas, and Plotly
Comprehensive tutorial on using NumPy, Pandas, and Plotly for data science in Python. Covers core concepts and practical applications with hands-on examples and free resources.
Linear Regressions with StatsModels - Data Science Tutorial
Learn to create linear regressions using StatsModels, exploring datasets and examples with NumPy, Pandas, Matplotlib, and Seaborn. Analyze professor ratings and tipping strategies through practical applications.
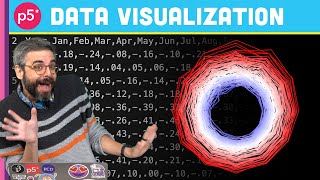
Visualizing Climate Data
Create a climate spiral visualization using p5.js to illustrate temperature changes over time. Learn data handling, polar coordinates, and animation techniques to effectively represent climate data.
Nonlinear Data Analysis for Teachers - Professional Development
Explore nonlinear data analysis techniques for real-world applications, including residual assessment, inverse function linearization, and implementation of CCSS Mathematical Practices with web resources.
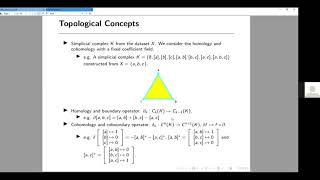
Hengrui Luo - Generalized Penalty for Circular Coordinate Representation
Explore dimension reduction using circular coordinates and generalized penalties in topological data analysis. Enhance visualization of high-dimensional datasets while preserving topological structures.

An Introduction to the Topology ToolKit
Comprehensive introduction to the Topology ToolKit (TTK) for topological data analysis and visualization, covering usage in ParaView and Python, advanced features, and resources for further learning.
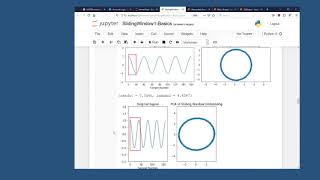
TDALabs - Some of TDA's Greatest Hits in Interactive Python
Interactive exploration of TDA's key applications using Python, covering time series analysis, image processing, 3D shape clustering, and more. Hands-on examples showcase TDA's versatility and practical uses.
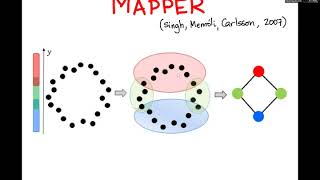
An Introduction to Mapper
Explore Mapper, a topological data analysis technique for visualizing complex datasets. Learn its principles, applications, and how it reveals hidden structures through clustering and graph representation.
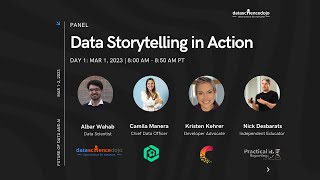
Data Storytelling in Action
Explore data storytelling with industry experts as they discuss visualization techniques, audience engagement, and emerging trends to effectively communicate insights across various fields.