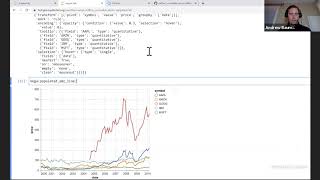
Encoding Multi-Layered Vega-Lite COVID-19 Geodata Visualizations with MLflow
Learn to create and manage multi-layered Vega-Lite visualizations for COVID-19 geodata using MLflow, enhancing data communication and lifecycle management for powerful insights.
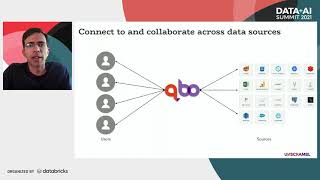
Natural Language Query and Conversational Interface to Apache Spark
Explore conversational analytics with Apache Spark, enabling natural language queries for data insights. Learn about NLP-to-SQL translation and its integration with dialog management and visualization.
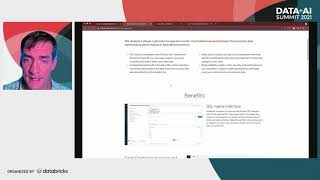
Learn to Use Databricks for Data Science
Discover how Databricks simplifies data science with a unified platform for analytics workloads, from data preparation to predictive analytics, enhancing collaboration and productivity at scale.
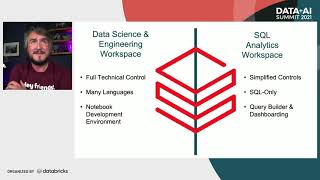
Getting Started with Databricks SQL Analytics
Explore Databricks SQL Analytics: set up SQL endpoints, query workspaces, create dashboards, and connect BI tools. Learn how this tool enhances the Lakehouse architecture for SQL-savvy data analysts.
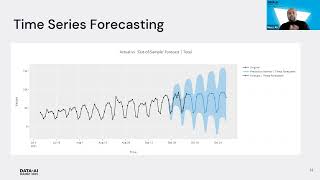
Time Series Forecasting with PyCaret
Explore automated time series forecasting with PyCaret's low-code module. Learn setup, EDA, training, and forecasting techniques to streamline your predictive modeling workflow.
Databricks Workspace Tour and Notebook Demo - Lesson 3
Comprehensive tour of Databricks Workspace, demonstrating tools and features with focus on the proprietary notebook IDE. Provides foundation for advanced Databricks and Apache Spark usage.
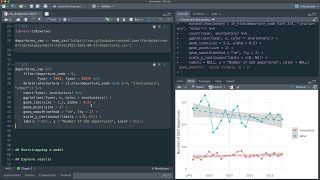
Estimate Change in CEO Departures With Bootstrap Resampling
Explore bootstrap resampling with tidymodels to analyze trends in CEO departures, using generalized linear models and #TidyTuesday data.
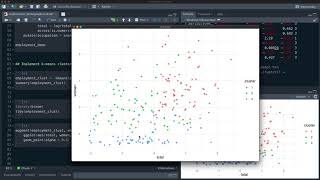
Explore Demographic Employment Data With K-Means
Explore employment demographics using k-means clustering to identify similarities across industries and roles, with hands-on data analysis and visualization techniques.
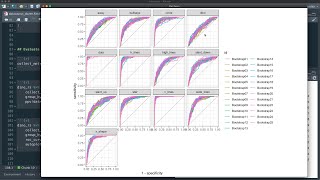
Predict Class Membership for the Datasaurus Dozen With Tidymodels
Explore multiclass evaluation metrics for random forest models using the Datasaurus Dozen dataset, focusing on model performance and visualization techniques.

Data Science: Introduction to Pandas
Explore Pandas for data manipulation: peek, sort, filter, and analyze with mathematical functions, correlation, and covariance.
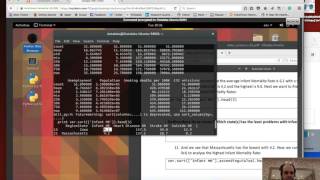
Data Science Tutorial 1 - Pandas Analysis
Learn to analyze data using Pandas, covering data types, columns, plotting, correlation, and covariance in this comprehensive tutorial.

Data Analysis with Pandas
Learn essential Pandas techniques for data analysis, including data manipulation, correlation analysis, and visualization, to enhance your Python data science skills.
Portable and Scalable Data Visualization Techniques for Apache Spark and Python Notebooks
Explore portable and scalable data visualization techniques for Apache Spark and Python notebooks, covering strategies, packages, headless rendering, animations, and big data integration.
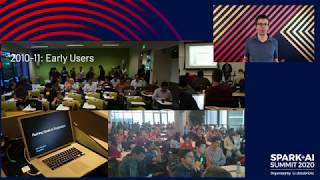
Introducing Apache Spark 3.0 - A Decade of Progress and Future Outlook
Apache Spark 3.0: Reflecting on a decade of progress and unveiling new features to enhance data processing accessibility, speed, and compatibility across various sources and environments.
Slowly Changing Dimensions Type 2 in Data Lakes - Tech Chat
Explore Slowly Changing Dimensions Type 2 in data lakes using Delta Lake, focusing on market segmentation for a climbing eCommerce site. Learn to track historical and current data effectively.
Big Data and Cyber Security - David Stubley
Explore the intersection of big data and cybersecurity, covering data management, visualization, and key drivers in this informative talk by David Stubley.
Using Theories of Decision-Making Under Uncertainty to Improve Data Visualization
Explore decision-making under uncertainty to enhance data visualization. Learn techniques for improving inductive reasoning, pattern finding, and effect size judgment in visual data analysis and communication.

The New ACM Digital Library - User and Administrator Training
Explore ACM's new Digital Library interface, featuring enhanced search capabilities, user profiles, and administrative tools for efficient access to computing research and publications.
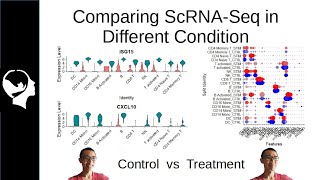
Comparing scRNA-Seq - Seurat Integration Analysis
Learn to integrate and compare scRNA-Seq datasets from different conditions using Seurat, covering data import, integration, differential expression analysis, and visualization techniques.
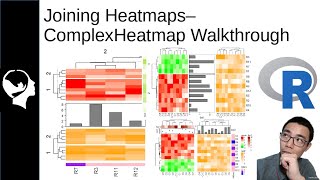
Joining Multiple Heatmaps - ComplexHeatMap Tutorial
Learn to combine multiple heatmaps in R using ComplexHeatmap. Master horizontal and vertical merging, customization, and annotations for effective data visualization in bioinformatics.
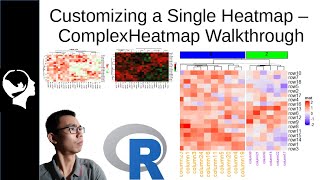
Creating a Heatmap in R - ComplexHeatmap Tutorial Part 1
Learn to create intricate heatmaps in R using ComplexHeatmap package. Master setup, color customization, title modification, and data ordering for effective visualization of multidimensional genomic data.