
Does Instagram Think You Live in an Influential City? - A Deep Dive Into Web Data
Explore Instagram's city influence using a 40GB dataset. Learn data cleaning, ML algorithms, visualization, and dashboard creation for impactful business insights.
The Google Guide to Exploratory Data Analysis - With Code
Learn to apply Google's Exploratory Data Analysis guide using productivity data, covering data cleaning, visualization, and statistical techniques for insightful analysis and feature selection.
Exploratory Data Analysis
Learn techniques for extracting meaningful insights from new datasets through hands-on exploratory data analysis, covering data import, filtering, visualization, and advanced manipulation methods.
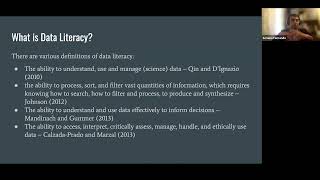
Data Literacy and the Role of the Visualization Designer
Explore data literacy's importance and the visualization designer's role in effective data comprehension. Learn key aspects of impactful visualizations and industry challenges through real-world examples and expert insights.

MOSIP Research Platform - Integrating Anomaly Detection Prototypes into Centralized ID Systems
Explore novel anomaly detection methods for digital identity systems using autoencoders, with a focus on fraud prevention during registration in MOSIP architecture.

Effective Data Visualisation - With Valentina D'Efilippo
Explore innovative data visualization techniques beyond standard charts with designer Valentina D'Efilippo. Learn to create impactful visual stories through creative approaches, empathy, and unique perspectives on data representation.
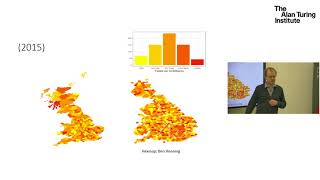
Does Campaigning on Social Media Make a Difference? Evidence from Candidate Use of Twitter
Explore the impact of social media campaigning on elections using data science. Analyze Twitter usage by candidates, voter engagement, and campaign strategies to understand modern political landscapes.
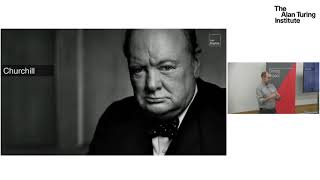
Digital Data Products and Changing Conversations - Dr Ryan Dunn, Department for Work and Pensions
Exploring data science's role in public discourse, this talk addresses challenges in using data for decision-making and fostering trust in statistics, emphasizing accessibility and transparency.

Gatling Beginner Tutorial - Show Gatling Results on Grafana Dashboard
Learn to visualize Gatling performance test results on Grafana dashboards. Covers Grafana setup, Gatling plugin installation, data source configuration, and dashboard creation for effective result analysis.

Data Analysis with Excel
Learn to analyze data efficiently using Excel's powerful tools, including sorting, filtering, pivot tables, and data visualization techniques for improved business insights.
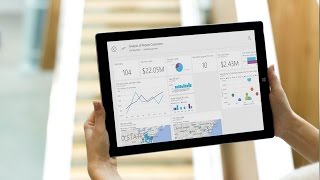
Power BI Training Video
Learn to create impactful data visualizations with Microsoft Power BI. Master data sources, relationships, charts, DAX functions, and publishing for effective decision-making and actionable insights.
Excel - Visualize Your Data
Unlock Excel's data analysis power: learn XLOOKUP, Pivot Tables, Slicers, and Timelines to visualize and extract insights from large datasets.
Visualizing Data with Power BI
Explore data visualization techniques using Power BI, covering key features, data modeling, and creating impactful visualizations for effective business intelligence and reporting.
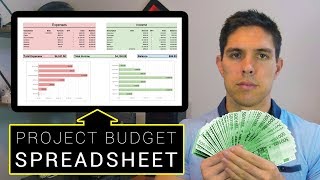
How to Make a Project Budget Spreadsheet
Learn to create a comprehensive project budget spreadsheet with easy-to-follow steps, including calculations, fundraising tracking, and visual charts for competitions and folios.
Introduction to Python for Data Science
Explore Python tools for data science, covering data processing, visualization, and modeling. Learn end-to-end data science through a real-world case study with expert insights.
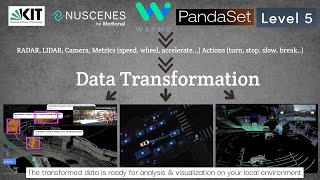
Transform Open-Source Self-Driving Cars Data to Analyze and Visualize Locally with Streetscape.gl
Learn to visualize and analyze self-driving car datasets locally using streetscape.gl. Step-by-step guide to download, transform, and explore KITTI and NuScenes data with open-source tools for in-depth autonomous vehicle analysis.
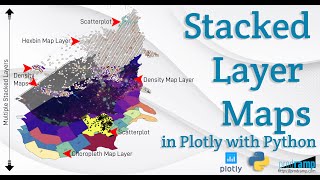
Beautiful and Informative Multilayer Stacked Geo Maps in Plotly With Python
Learn to create multi-layer stacked geo maps in Plotly with Python, combining hexbin, scatter, and density layers for beautiful and informative geospatial data visualizations and dashboards.
How You Can Build Your Own Worldwide Wildfire Data Collection and Host on Kaggle
Learn to collect, process, and visualize global wildfire data using NASA sources, data engineering techniques, and tools like Kepler.gl, mapboxgl, and Streamlit for insightful analysis and presentation.

Implementing Nivo Graphs into CoreUI React Template
Comprehensive guide to integrating Nivo graphs into CoreUI React template, covering various chart types, customization, and implementation steps for creating interactive data visualizations.
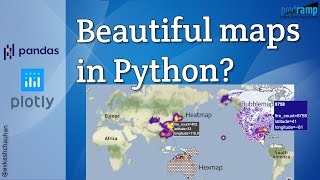
Impactful and Informative Geo Maps With Pandas and Plotly
Create impactful geo maps using Pandas and Plotly. Learn to visualize large datasets with bubble, heat, and hexagon maps. Hands-on tutorial covers data processing, Plotly integration, and map creation techniques.
Excel Training - Complete Course
Comprehensive Excel training covering worksheets, formatting, functions, charts, and case studies. Develop essential skills for data management and analysis through hands-on practice and real-world applications.