
Intro to Data Visualization in Python with Matplotlib - Line Graph, Bar Chart, Title, Labels, Size
Learn to create and customize line graphs and bar charts using Matplotlib in Python, covering essential visualization techniques like styling, scaling, and annotating plots.
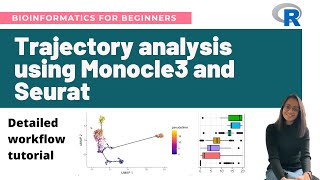
Single-Cell Trajectory Analysis Using Monocle3 and Seurat - Step-by-Step Tutorial
Step-by-step tutorial on single-cell trajectory analysis using Monocle3 and Seurat. Covers theory, workflow, and practical implementation in R, including data processing, visualization, and gene expression analysis along trajectories.
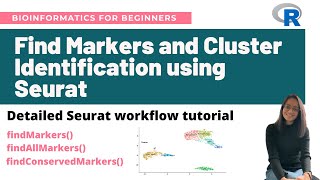
Find Markers and Cluster Identification in Single-Cell RNA-Seq Using Seurat - Workflow Tutorial
Comprehensive tutorial on identifying cell markers in single-cell RNA-Seq data using Seurat, covering various marker identification methods, data visualization, and cluster annotation techniques.
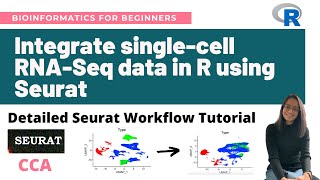
Integrate Single-Cell RNA-Seq Datasets in R Using Seurat - Detailed Seurat Workflow Tutorial
Comprehensive tutorial on integrating single-cell RNA-Seq datasets using Seurat in R, covering data merging, batch effect correction, and visualization techniques for improved analysis.

Visualize Gene Expression Data in R Using Ggplot2 - Bioinformatics for Beginners
Learn to visualize gene expression data using R and ggplot2. Create barplots, density plots, boxplots, scatterplots, and heatmaps from RNA-Seq data. Hands-on tutorial for beginners in bioinformatics.
Bridging Gaps Between Geospatial Data, Cloud Computing, and Local Disaster Organizations
Explore geospatial data integration for disaster response, covering UI challenges, rapid data delivery, and field-ready solutions using AWS, edge computing, and various data sources.
Power BI - Quick Project - Data Model
Explore data modeling in Power BI: create calculated columns, measures, and visuals to transform raw data into meaningful insights and interactive reports.
Tracking and Mapping Wi-Fi Networks from Aerial Drones - Data Visualization Tutorial
Learn to visualize Wi-Fi network data collected by drones using Python, Google Colab, and Jupyter notebooks. Explore techniques for mapping, clustering, and identifying specific devices.
Google Sheets Tutorial for Beginners - 2022 Edition
Comprehensive guide to Google Sheets basics: creating spreadsheets, importing data, formatting, sorting, using functions, filtering, data visualization, and collaboration features.
Create a KPI Dashboard with Whatagraph and Google Analytics
Learn to create an effective KPI dashboard using Whatagraph and Google Analytics data. Discover how to choose KPIs, set targets, and build visualizations for actionable insights.
Google Data Studio Tutorial – Building Google Analytics Dashboards Step-by-Step
Learn to create informative Google Analytics dashboards using Data Studio. Step-by-step guide covers visualization options, data connection, and building various chart types for effective data presentation.

New Google Data Studio Chart - Google Maps
Explore Google Data Studio's new Google Maps chart type for integrating location data. Learn creation, styling, and customization techniques for effective data visualization.
First Look- Pivot Tables in Google Data Studio
Explore data visualization with pivot tables in Google Data Studio. Learn to create multi-dimensional tables, use row and column dimensions, add filters, and enhance your dashboarding capabilities.
Google Data Studio Connectors
Explore Google Data Studio's new Community Connectors, enabling direct integration with Facebook Ads and other data sources. Learn about available connectors, guidelines, and how to build your own for enhanced data visualization capabilities.
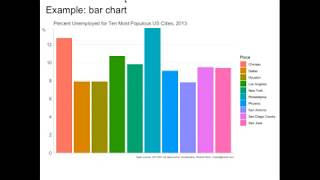
Data Visualization - From Square One to Interactivity
Learn to create effective data visualizations using Python libraries Matplotlib and Bokeh. Explore design principles, reduce clutter, and add interactivity to communicate insights clearly and compellingly.
Smart Technologies in Enhancing Browsing Experiences - Zona Kostic
Explore smart technologies enhancing browsing experiences through data visualization, interactive visualization, VR/AR, and visual analytics. Learn about human-machine communication and complex visualization techniques.
Creating Data Driven Cities
Explore how leveraging government data can revolutionize city operations, addressing community priorities and creating innovative solutions for urban challenges.
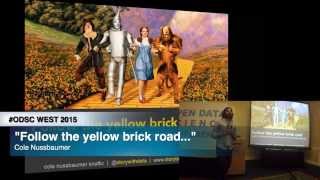
Follow the Yellow Brick Road - What the Wizard of Oz Can Teach You
Learn to craft compelling data stories using visualization techniques, design principles, and storytelling methods to effectively communicate insights and engage your audience.
Flight Delay Dataset Creation
Live coding session demonstrating the creation of a flight delay dataset using Python and Pandas. Learn data acquisition, cleaning, exploration, and visualization techniques with real-world airline data.
Complete Data Science Project
Explore Wordle tweet data through comprehensive EDA using Python, pandas, and matplotlib. Learn data wrangling, visualization techniques, and gain insights from a Kaggle Grandmaster's analysis.
Solving Real World Data Science Tasks With Python Pandas
Analyze real-world sales data using Python Pandas and Matplotlib. Learn data cleaning, exploration, and visualization techniques to answer key business questions and gain valuable insights.