
Splunk: Cloud-Native Infrastructure Monitoring at Scale
Gain end-to-end visibility into infrastructure and application performance with Splunk's cloud-native monitoring platform. Deploy easily, detect issues proactively, and leverage ML for insights.
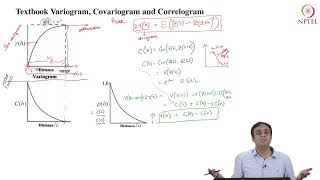
The Experimental Variogram
Explore the concept of experimental variograms, their calculation, interpretation, and applications in spatial data analysis and geostatistics.
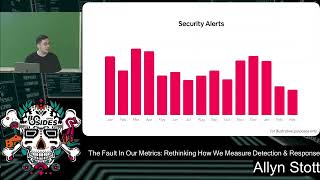
The Fault in Our Metrics: Rethinking How We Measure Detection and Response
Rethink detection and response metrics with a practical framework, new maturity model, and visual examples. Learn to measure capabilities effectively and tell a compelling story using micro-purple testing techniques.
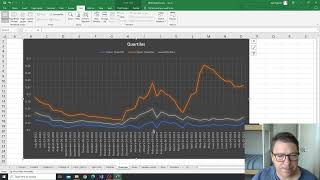
NDVI Analysis for Vegetation Change at Coorabulka Station - Part 6
Analyze temporal vegetation statistics using Excel, interpret graphs, and create a biomass proxy measure for Coorabulka Station's carrying capacity assessment.

Building a Live Streaming Lyme Disease Surveillance Tool Using Twitter
Explore a real-time Lyme disease surveillance dashboard using Twitter data, machine learning, and NLP techniques to enhance public health monitoring and facilitate prompt interventions during outbreaks.
Change the World with Data - Using Analytics for Community Development and Social Impact
Discover how community developers leverage data storytelling to drive economic impact, track social change, and create sustainable futures through innovative approaches to community development.
Business Intelligence Solutions: How to Use Data to Deliver Business Insights
Discover essential strategies for becoming a successful Business Intelligence Engineer, from mastering technical skills to delivering impactful data insights that drive organizational decision-making.
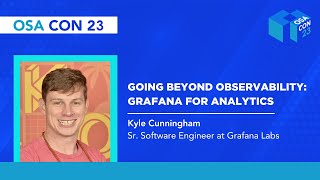
Going Beyond Observability - Grafana for Data Analysis and Visualization
Discover how Grafana evolves beyond monitoring to become a comprehensive data analysis platform, featuring new visualization tools and enhanced transformation capabilities for diverse analytical needs.
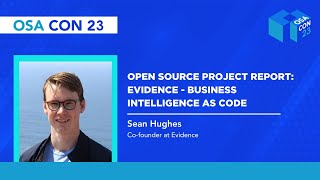
Evidence: Business Intelligence as Code - An Open Source Project Overview
Discover how Evidence transforms business intelligence through markdown and SQL, featuring DuckDB WebAssembly integration, interactive filters, and multi-source data connections.

Introduction to Numerical Computing with NumPy - SciPy 2019 Tutorial
Learn NumPy's powerful array processing capabilities, including array syntax, indexing, mathematical functions, and custom routines. Gain practical skills through hands-on examples and visualize results using matplotlib.

Qlik Sense Advanced Training - Data Visualization Tutorial
Master advanced Qlik Sense features: variables, dynamic loading, scripting, and data modeling. Enhance your data visualization skills with hands-on practice using downloadable course files.
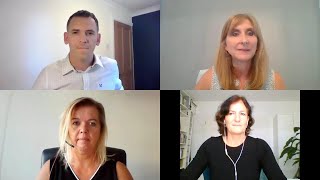
Oracle CX Cloud and Analytics: Aon's Journey to 50-60x Performance Improvements
Aon executives discuss CX Cloud, Analytics, and Oracle Autonomous Database implementation, highlighting performance improvements, cost savings, enhanced security, and digital transformation strategies.
Microsoft Planner Tutorial
Master Microsoft Planner for effective team project management. Learn to create plans, track tasks, build charts, and share with others. Ideal for streamlining collaboration and enhancing project transparency.

Visio 2019 Advanced Tutorial
Comprehensive tutorial on advanced Visio 2019 features, covering BPMN diagrams, 3D shapes, custom stencils, pivot diagrams, Gantt charts, macros, and integration with external data sources for enhanced visualization.
Excel 2019 - Intro to Data Analysis Tutorial
Learn essential data analysis techniques in Excel 2019, including table formatting, conditional functions, charting, and pivot tables. Gain skills to effectively analyze, summarize, and visualize your data.
Importing Lab Data to a Jupyter Notebook Using Pandas
Learn to import lab data into Jupyter notebooks using pandas, access and manipulate the data, and create plots with customized labels for effective data analysis and visualization.
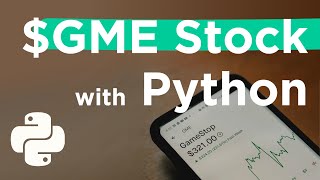
Building a Plotly GME Chart in Python
Learn to create an interactive stock chart for GameStop using Python, PlotLy, and AlphaVantage API, exploring the coding process from concept to implementation.
Science Communication in a Virtual World
Enhance science communication skills for diverse audiences in digital settings. Learn to identify your audience, eliminate jargon, and craft impactful messages for effective virtual interactions.

Python for Data Science - Beginner Friendly Full Course
Comprehensive Python tutorial covering fundamentals, data structures, control flow, functions, OOP, modules, file handling, and math operations, with practical data science applications and projects.
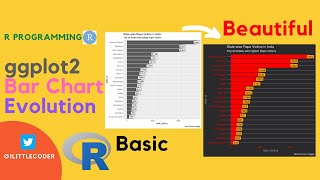
Make a Beautiful Ggplot2 Bar Chart from Basic to Powerful Themes
Learn to create stunning ggplot2 bar charts in R, from basic techniques to advanced theming. Master data cleaning, chart customization, and professional visualization using real-world crime data.
Microsoft Power BI Beginner to Intermediate Course - Data Visualization Training
Comprehensive training on Power BI covering data import, query manipulation, visualization creation, and report design. Learn to create interactive dashboards and gain practical skills in business intelligence.