
How Grafana Labs Builds and Sustains Communities
Explore Grafana Labs' strategies for building thriving open-source communities, drawing from decades of experience in fostering collaboration and sustainable growth in large-scale projects.
Visualizing MISP and ATT&CK Data in Maltego
Explore techniques for visualizing threat intelligence data from MISP and ATT&CK frameworks using Maltego, enhancing cybersecurity analysis and decision-making.

CTI Operational Procedures with Jupyter Notebooks and MISP
Learn to enhance Cyber Threat Intelligence operations using Jupyter Notebooks and MISP. Explore practical techniques for data analysis, visualization, and threat information sharing.
Challenging Power in Data Science
Explore ethical data practices through a feminist lens, examining power dynamics, classification systems, and invisible labor to create more equitable data science approaches.
Enforcing Supply Chain Security and Simplifying Compliance Audit for ArgoCD Deployments
Explore techniques for securing supply chains and simplifying compliance audits in ArgoCD deployments using open-source tools like Guac, Sigstore, and in-toto.
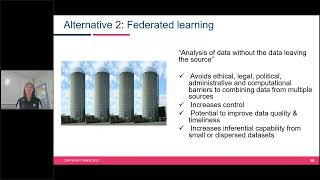
Making Private Data Open and Enhancing Decision-Making Through Digital Atlases
Explore innovative approaches to data sharing, privacy preservation, and decision-making enhancement through digital atlases, focusing on the Australian Cancer Atlas and Bayesian statistical models.
Embedded Linux Quality Assurance: How to Not Lie with Statistics
Explore statistical quality assurance for embedded Linux systems, covering best practices, automated testing, and data evaluation using R. Learn to avoid common pitfalls in interpreting results.

Election Simulation 2: Voting in Multiple Dimensions
Explore multi-dimensional voting impact on voter satisfaction through code modification in this physics-based election simulation video.

The Rise of Cyber Cartels - The Future of Tech and Crime
Exploring the rise of cyber cartels: Data visualization tools to track and combat tech-enabled crime, presented by expert researcher Robert Muggah at Web Summit 2014.

Maltego - Automated Information Gathering
Explore automated information gathering with Maltego in this tutorial. Learn to efficiently collect and analyze data for cybersecurity and intelligence purposes.
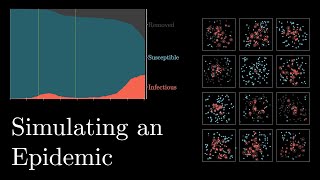
Simulating an Epidemic
Explore epidemic dynamics through toy SIR models, visualizing how various factors influence disease spread and containment strategies.
Latest Developments at chipshub and nanoHUB
Explore new AI, data, and EDA tools on nanoHUB and chipshub, plus Birck Nanotechnology Center's experimental data visualization and modeling resources.

Pulling Pictures Out of an Undocumented File Format - Let Me at My Data!
Uncover the process of extracting data from an undocumented file format, following a developer's journey to transform real-world exploration data into wall art through reverse engineering and problem-solving.
Locally Private Histograms in All Privacy Regimes
Explore frequency estimation in data analysis, focusing on local differential privacy. Learn about algorithms, error bounds, and the intriguing low-privacy regime in histogram computation.

How Sand and Java Are Used to Create the World's Most Powerful Chips
Explore the fascinating world of chip manufacturing, from sand to powerful processors, and discover Java's role in optimizing this cutting-edge process.
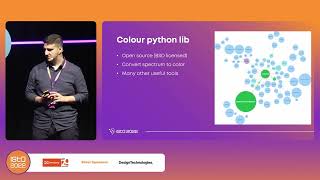
Earth Through the Eye of a Satellite - ISTA Conference Talk
Explore Earth's landscapes through satellite imagery, gaining insights into remote sensing and its applications in environmental monitoring and resource management.
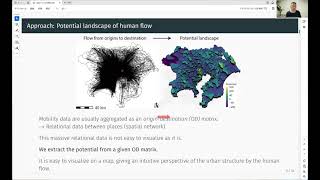
Potential Landscape of Human Flow in Cities
Visualizing urban human flow using combinatorial Hodge theory to create potential landscapes, revealing attractive locations and urban structures for informed decision-making in city planning and development.

ME3255 - FEA Solutions and Visualizing Results
Explore finite element analysis solutions and result visualization techniques for engineering applications. Enhance problem-solving skills in structural mechanics and design optimization.

Chart Talk - How the Immigration Numbers Add Up
Explore immigration's impact on US economy and workforce with data-driven analysis. Uncover facts about wages, economic needs, and immigration trends in this insightful presentation.
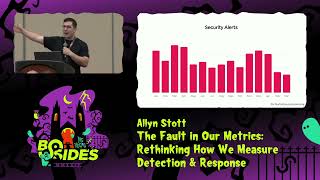
The Fault in Our Metrics - Rethinking How We Measure Detection and Response
Rethinking cybersecurity metrics: A practical framework for developing effective detection & response measurements that incentivize progress and tell a compelling story to leadership.
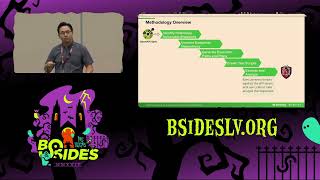
BOLABuster: Harnessing LLMs for Automating BOLA Detection
Harnessing LLMs to automate BOLA detection in APIs and web applications, reducing requests by 99% while uncovering critical vulnerabilities and submitting multiple CVEs.