Alerting in the Prometheus Ecosystem - The Past, Present and Future
Explore the evolution of Prometheus Alertmanager, from its modular architecture to improvements in Cortex and Grafana integration. Learn about current developments and future plans for this critical cloud native observability tool.

Prometheus Sparse High-Resolution Histograms in Action
Explore Prometheus sparse high-resolution histograms: instrumentation, ingestion, storage, querying, and visualization. Learn about precise quantile estimations and high-resolution heatmaps with real-world benchmarks.
SIG Scalability in Kubernetes - Introduction and Deep Dive
Explore Kubernetes scalability: definition, measurement, testing infrastructure, performance improvements, and regression prevention. Learn about SIG Scalability's efforts and future roadmap.
Energy Efficient Placement of Edge Workloads
Explore Kepler for container-level energy metrics in Kubernetes, enabling efficient workload placement and sustainable cluster management through integration with observability tools.
Leveraging OpenTelemetry for Your Prometheus Pipeline
Explore OpenTelemetry's integration with Prometheus, covering receivers, exporters, migration paths, and common scenarios for leveraging OTel in your metrics pipeline.
Observing Kubernetes Networking with Cilium, Hubble, and Grafana
Explore Kubernetes networking observability using Cilium, Hubble, and Grafana. Learn to visualize application communication, debug issues, and uncover underlying problems in complex cloud-native environments.
What is Tech Insights? Understanding and Implementing Backstage Features
Explore tech insights in Backstage: track engineering standards, visualize data, and extend functionality. Learn to manage tech health and drive company standards with practical examples.
Intro to Kubernetes, GitOps, and Observability - Hands-On Tutorial
Hands-on tutorial exploring Kubernetes, GitOps, and Observability. Learn key concepts, practice commands, and experience benefits like improved reliability, velocity, and security in cloud-native environments.
Analyzing and Visualizing OpenTelemetry Traces with SQL
Hands-on workshop exploring OpenTelemetry trace analysis using SQL and Grafana. Learn to ingest, query, and visualize distributed system data for powerful insights and proactive issue detection.
SneakOps - Implementing GitOps Without User Awareness
Learn how to implement GitOps for Kubernetes deployments without disrupting end-user workflows. Discover strategies to transform messy environments into efficient, process-driven systems using GitOps, Kubernetes, and Terraform.
DoorDash's Journey from StatsD to Prometheus - Scaling to 10 Million Metrics per Second
Explore DoorDash's migration from StatsD to Prometheus, handling 10 million metrics/second. Learn best practices, challenges, and lessons for efficient large-scale metric management.
Energy Observability Using Kepler - Revolutionizing Cloud Efficiency
Explore Kepler, an innovative framework for monitoring power consumption in Kubernetes environments, enhancing cloud efficiency through advanced observability techniques and machine learning.
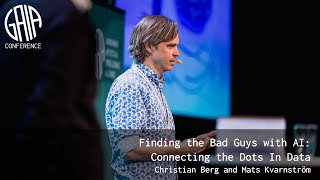
Finding the Bad Guys with AI - Connecting the Dots in Data
Explore AI-powered data analysis for law enforcement, connecting diverse information sources to uncover hidden links. Learn about Paliscope's innovative software and its real-world applications.
Mastering Windows Monitoring in Kubernetes Environments
Implement Windows monitoring in Kubernetes using HostProcess containers, Windows exporter, Prometheus, and Grafana. Learn metric collection, deployment, and analysis for effective Windows node management.
Hacking OpenTelemetry - Manipulating Observability Pillars
Explore OpenTelemetry hacking techniques to manipulate observability pillars, transform logs into traces, and optimize data flow for enhanced system monitoring and analysis.
Observability 101 Using Generative Art and Rising Wave
Explore observability using generative art and Rising Wave. Learn system monitoring, streaming databases, and practical applications for engineers and students.
Techniques for SLOs and Error Budgets at Scale
Explore techniques for implementing SLOs and error budgets at scale. Learn to quantify latency, measure availability, and use histograms effectively for large-scale systems and engineering teams.
A Hitchhiker's Guide to the MLOps Experience
Explore MLOps essentials: data versioning, visualizations, experiment tracking, and model registry. Learn key components and UX tips for streamlining machine learning workflows.
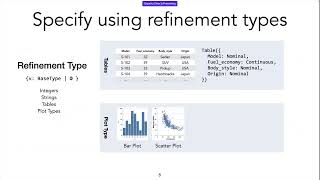
Type-Directed Synthesis of Visualizations from Natural Language Queries
Explore a novel technique for generating visualizations from natural language queries using program synthesis and refinement types, outperforming existing tools.
Complete TensorBoard Guide
Comprehensive guide to TensorBoard features including loss plots, image visualization, confusion matrices, hyperparameter tuning, embedding projections, and TensorFlow profiler for model optimization and analysis.
Pytorch TensorBoard Tutorial
Comprehensive guide to TensorBoard in PyTorch: plotting functions, hyperparameter search, image and weight visualization, and embedding projector. Practical examples included.