
Unlocking the Power of What-If Analysis for BI, Data, and AI with Taipy
Explore practical implementation of what-if analysis using Taipy for data exploration and decision-making. Learn to assess outcomes by varying input parameters in datasets.
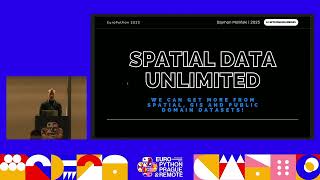
We Can Get More from Spatial, GIS, and Public Domain Datasets
Explore spatial data analysis and interpolation techniques using pyinterpolate for insights on rental prices, pollution mapping, and socio-economic factors at various scales.
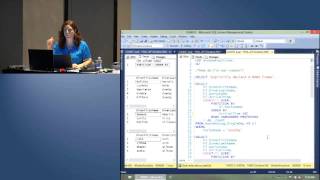
Building Your T-SQL Tool Kit - Window Function Fundamentals
Explore T-SQL window functions to enhance data analysis skills, improve query performance, and solve complex business problems efficiently.

Microsoft's Data Platform
Explore Microsoft's data platform vision and strategy, including latest innovations and future directions in database technology and analytics.

Data Mining in SQL Server Analysis Services
Explore advanced data mining techniques using SQL Server Analysis Services to uncover hidden patterns and gain valuable insights from your datasets.

Business Analytics 2013 - From Data to Insight - Views from Microsoft Finance
Explore Microsoft Finance's approach to transforming data into actionable insights, enhancing decision-making and business performance through advanced analytics techniques.
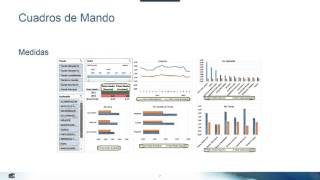
24HoP Spanish - Cuadros de Mando El todo es más que la suma de las partes
Aprende a crear cuadros de mando efectivos en español, explorando cómo integrar elementos para obtener insights valiosos más allá de la simple suma de datos.
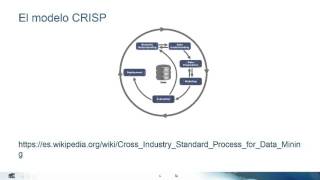
Analizando patrones con SQL, Excel, Azure ML, R y más
Explora técnicas avanzadas de análisis de patrones utilizando SQL, Excel, Azure ML y R para obtener insights valiosos y mejorar la toma de decisiones en ciencia de datos.

Business Analytics Marathon - Tools for Exploratory Data Analysis
Explore essential tools for data analysis, including Power Query and Pivot Tables, with practical demos and insights into machine learning applications.
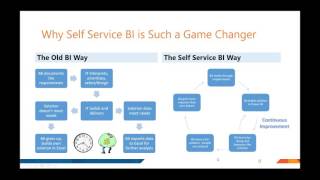
Business Analytics Marathon - Moving From Excel to Power BI
Transition from Excel to Power BI for advanced business analytics, covering reporting, visualization, and SharePoint integration.
Business Analytics Marathon - Implementing Data-Based Decision Making
Implement data-driven decision-making strategies through advanced analytics techniques and best practices for effective business intelligence.

Building a Scalable Analytical Solution Using IaaS and Elasticsearch
Learn to build a scalable analytical solution using Infrastructure as a Service and Elasticsearch, exploring key concepts and best practices for efficient data processing and analysis.
Optimize All Data with a Modern Data Warehouse Solution
Explore modern data warehouse solutions for optimizing data lifecycle, enhancing business insights, and maximizing value from your data infrastructure.
Visualizing Data - The Good, the Bad, and the Ugly
Explore effective data visualization techniques, from time series to deviations, using Excel, Power BI, and other tools. Learn to create impactful charts and avoid common pitfalls in data presentation.

Distributed Replay Testing with Your Data, Your Way
Explore distributed replay testing for SQL Server, covering limitations, components, configuration, and practical applications for optimizing database performance.
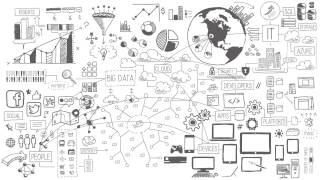
Finding Your Balance - BI in the Cloud, On Premises, or Both
Explore BI solutions across cloud, on-premises, and hybrid environments. Learn about Power BI, SQL Server, Azure services, and tools for effective data analysis and decision-making.
Azure IOT - A Practical Introduction to Stream Analytics
Explore Azure Stream Analytics for real-time IoT data processing. Learn to capture, analyze, and present device data streams, integrating with Microsoft's IoT suite for business insights.
Aprende todo sobre Business Intelligence con SQL Server 2012, SharePoint y Excel 2013
Domina las herramientas de Business Intelligence: SQL Server 2012, SharePoint y Excel 2013. Desarrolla habilidades para analizar datos y tomar decisiones empresariales informadas.
Catching the Butterfly in Data - Chaos or Patterns in the Data
Explore data analysis techniques, chaos theory, and pattern recognition in this webinar. Learn about Benford's Law, debt visualization, and advanced economic insights for business analysts.
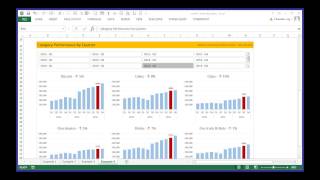
Productivity Revolution in Excel
Discover how to leverage Excel and Power BI for powerful business intelligence. Learn to create charts, dashboards, and formulas, and master data extraction, modeling, and visualization techniques.
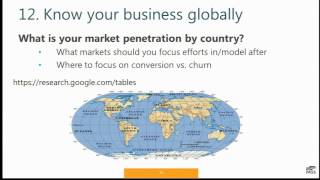
Growth Hacking Using Data
Learn data-driven growth strategies, including identifying key metrics, analyzing engagement, understanding funnels and cohorts, and effectively communicating insights to drive business decisions and success.