Data Cleaning in Excel - Text Functions and Power Query
Learn essential data cleaning techniques in Excel using text functions and Power Query. Master importing, formatting, and manipulating data for accurate analysis and improved efficiency.
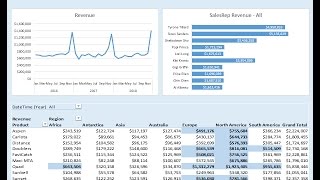
How to Build Excel Dashboard - PivotTable, Chart, Conditional Formatting
Learn to create an Excel dashboard using Power Query, PivotTables, charts, and DAX measures. Master data modeling, conditional formatting, and dynamic updates for effective data visualization and analysis.

Data Analytics Using Excel
Master Excel for data analytics: clean, analyze, and visualize data using functions, pivot tables, and charts. Gain practical skills for data-driven decision-making and career advancement.

The Ultimate Excel Tutorial - Beginner to Advanced
Comprehensive Excel mastery: from basic formulas to advanced techniques like VBA macros, covering data cleaning, pivot tables, and dynamic arrays for enhanced productivity.

Pivot Table Excel Tutorial
Learn to create, analyze, and visualize data with Excel Pivot Tables. Master data cleaning, formatting, grouping, and advanced features like Pivot Charts and Slicers in this comprehensive tutorial.
Data Preparation Toolkit for LLM Application Developers
Explore the critical role of data preparation in developing high-performing Large Language Models (LLMs) in this one-hour webinar from Data Science Dojo. Delve into the importance of quality and quantity in text and code corpora for training LLMs. Learn…
Good, Fast, Cheap - How to Do Data Science with Missing Data
Explore strategies for handling missing data in data science projects, including visualization, identification, and practical implementation techniques for effective workflow integration.
Essential Workshop to Exploratory Data Analysis and Feature Engineering
Explore and preprocess data, analyze correlations and distributions, engineer features, and train ML models using a Google Play Store dataset. Improve model accuracy and efficiency.

How to Build and Design Charts and Dashboards in Excel
Master Excel data cleaning, custom formatting, and chart creation to transform raw information into visually impactful dashboards and presentations.
Best Practices With Pandas
Discover efficient data science techniques using pandas, covering tasks like group comparisons, handling missing values, and creating insightful plots with real-world datasets.

Machine Learning
Comprehensive introduction to machine learning, covering algorithms, data analytics, and predictive modeling. Includes hands-on tutorials on data preparation, visualization, and decision tree implementation.

Data Analyst Portfolio Projects
Comprehensive guide to building a data analyst portfolio through hands-on projects in SQL, Tableau, Python, and Excel, covering data exploration, visualization, cleaning, and analysis.

Data Science Fundamentals
Learn essential data science skills: exploration, manipulation, cleaning, and analysis using Python, Pandas, SQL, and more. Ideal for beginners seeking practical knowledge.
Data Science Project From Scratch
Learn to plan, collect, clean, analyze, model, and deploy a data science project, with practical examples and portfolio-building opportunities.
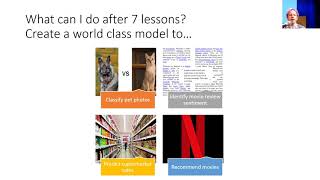
Practical Deep Learning for Coders 2019
Comprehensive deep learning course covering image classification, NLP, tabular data, and advanced topics. Includes hands-on coding and ethical considerations.
Fixing String Inconsistencies in PostgreSQL
Explore PostgreSQL's string handling features to improve data quality. Learn pattern matching, regular expressions, and advanced extensions for fixing inconsistencies and ensuring accurate results.

R Programming Crash Course
Comprehensive introduction to R programming, covering installation, data types, data manipulation with dplyr, visualization with ggplot2, and practical data analysis techniques for beginners.

Pandas Tutorial
Comprehensive guide to Pandas framework for data manipulation, analysis, and visualization, covering key concepts and practical examples for effective data science workflows.
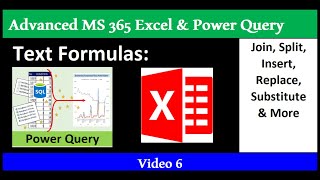
Text Formulas & Functions in Excel Worksheet and Power Query
Comprehensive tutorial on Excel text functions and Power Query, covering formulas, data extraction, error handling, and data cleaning techniques for efficient spreadsheet management.
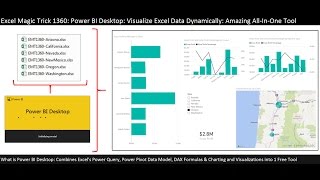
Comprehensive Power BI Desktop Example - Visualize Excel Data & Build Dynamic Dashboard
Learn to import, transform, and visualize Excel data in Power BI Desktop. Create dynamic dashboards with maps, charts, and slicers while mastering DAX calculations for insightful business analytics.
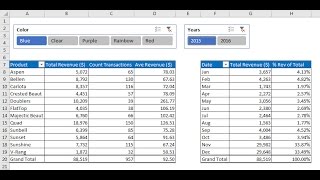
Data Analysis Fundamentals - PivotTables, Power Query & Data Model
Master Excel data analysis with PivotTables, Power Query, and Data Model. Learn sorting, filtering, and advanced techniques to handle large datasets efficiently and create insightful reports.