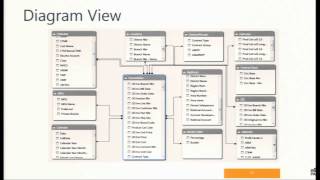
The Reality of Industrial Strength Excel - A Case Study
Discover how Excel revolutionized Kaman Industrial Technologies' performance measurement, driving micro-changes across 180+ locations and improving profitability in just four months.
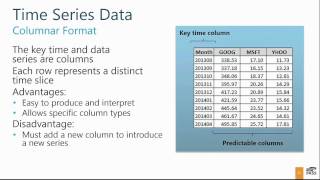
Introduction to Time Series Forecasting
Learn intuitive time series forecasting using Microsoft's algorithm in SQL Server Analysis Services. Explore data preparation, model creation, querying, and result interpretation through Visual Studio and Excel demonstrations.
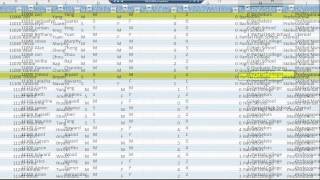
Advanced Analytics in Excel 2013
Explore advanced data mining techniques in Excel 2013, including PowerPivot integration, big data analysis, and innovative data mashup methods for enhanced analytical capabilities.
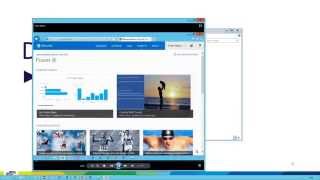
Past to Future - Self-service Forecasting with Microsoft BI
Explore time series forecasting with Microsoft Self-Service BI tools. Learn fundamentals, Excel capabilities, and Power View's predictive analytics for visually impressive forecasts and hindcasts.
Business Intelligence Toolkit Overview - Microsoft Power BI and R
Explore data visualization with Power BI and R, focusing on cognitive psychology theory and practical applications for creating effective dashboards and analyses.
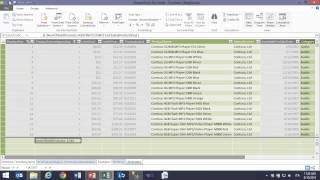
DAX Formulas in Action
Explore DAX formulas for BI solutions in Excel and SQL Server. Learn to create calculated columns, measures, and effective PivotTable analysis through hands-on demonstrations.
Power BI Deep Dive
Explora las nuevas capacidades de Excel y Office 365 para Business Intelligence. Descubre, analiza y visualiza datos en Excel, y comparte tus hallazgos a través de Office 365.
Unlocking Data Insights
Empower users with robust BI tools to transform raw data into business insights. Learn to enable easy data access, leverage Microsoft's tools, and build a comprehensive data platform across on-premises, cloud, and devices.
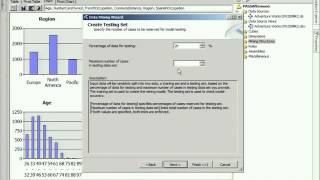
Introduction to Data Mining in SQL Server Analysis Services
Learn to create and integrate data mining models in SQL Server Analysis Services for customer prediction, marketing optimization, and forecasting using various algorithms and tools.
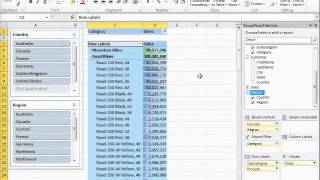
End-to-End SQL Server PowerPivot
Explore SQL Server PowerPivot add-ins for Excel and SharePoint, enabling large-scale data analysis, multidimensional modeling, and collaborative business intelligence within familiar Microsoft tools.
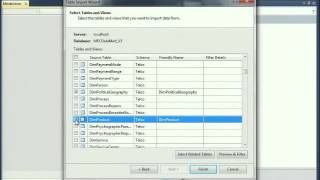
Developing and Managing a Business Intelligence Semantic Model in SQL Server Analysis Services
Learn to create, manage, and troubleshoot BI Semantic Models using SQL Server "Denali" features, with PowerPivot as a starting point for enhanced business intelligence capabilities.
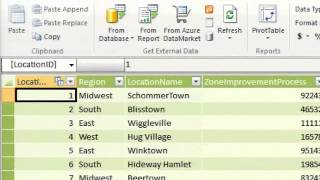
PowerPivot - A Cool Reporting Tool
Explore PowerPivot for Excel to combine diverse data sources, create analytics, and overcome Excel limitations. Learn to import, pivot, and visualize data for self-service business intelligence.
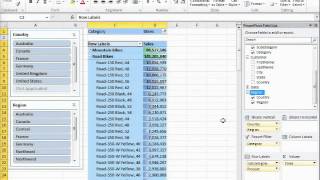
End-to-End SQL Server PowerPivot
Explore SQL Server PowerPivot add-ins for Excel and SharePoint, enabling large-scale data analysis, multidimensional modeling, and collaborative BI solutions with scheduled data refreshes and IT management.
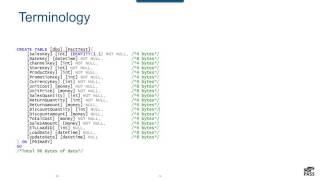
A Lap Around Columnstore and 2016 Operational Analytics
Explore Columnstore and 2016 Operational Analytics in SQL Server, focusing on performance improvements and real-time analytics capabilities for data-driven decision making.
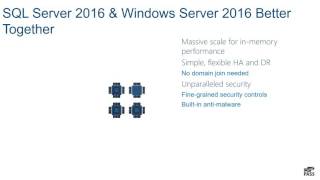
SQL Server 2016 Hero Features in Action - Full Lifecycle of Financial Data
Explore SQL Server 2016's hero features, including record-breaking performance, enhanced availability, in-memory OLTP, and secure data protection, with practical applications in financial data management.
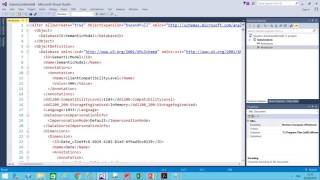
What's New in SQL Server 2016 Analysis Services
Explore new features in SQL Server 2016 Analysis Services, including Extended Events, Tabular Mode enhancements, DAX functions, and Direct Query improvements for more powerful data analysis.
Data Storytelling 101
Learn effective data storytelling techniques to create impactful visual narratives, focusing on key elements like goal-setting, snapshots, and actionable insights for compelling business intelligence presentations.
Monitoring DevOps Driven Microservices Apps
Explore how InfluxData's time-series platform enhances DevOps initiatives, providing granular sub-second monitoring for anomaly detection and performance optimization in microservices applications.
From Power BI to Power AI
Explore integrating R, Azure Machine Learning, and advanced Power BI features for enhanced data insights and automated analysis capabilities.
Power BI for Enterprises
Explore advanced Power BI techniques for robust, reliable, and scalable enterprise solutions. Learn essential features to enhance your data analysis and visualization capabilities.

Dashboard Designing - From 0 to Hero
Transform raw data into actionable insights with Power BI. Learn data modeling, visual slicing, report creation, and advanced features for effective dashboard design.