
Quantitative Finance
Comprehensive exploration of financial modeling, risk analysis, and investment strategies, equipping learners with advanced tools for data-driven decision-making in the financial sector.
Financial Accounting
This course discusses the basic concepts of financial accounting and reporting. The viewpoint is that of readers of financial reports rather than the accountants who prepare them.
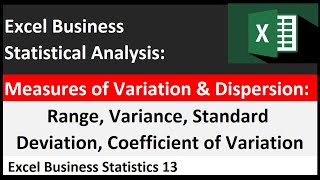
Excel Statistical Analysis - Range, Variance, Standard Deviation, Coefficient of Variation
Master Excel's statistical analysis tools for calculating range, variance, standard deviation, and coefficient of variation. Apply these measures to make informed business decisions and interpret financial data.

Google Sheets for Excel Users Tutorial
Accelerated training for Excel experts to master Google Sheets, covering advanced features like conditional formatting, real-time collaboration, interactive forms, financial data integration, and automation through macros.
Detecting Price and Volume Patterns with SQL and TimescaleDB
Learn to detect stock price patterns using SQL and TimescaleDB. Explore PostgreSQL functions, TimescaleDB features, and analyze real-world examples to identify bullish engulfing and three-bar breakout patterns.
Finding the Best Investments Using Technical Analysis
Learn technical analysis techniques to identify top-performing securities across sectors, create diversified portfolios, and use the Ichimoku Cloud for momentum trading. Includes hands-on Python coding for data analysis and visualization.
Technical Analysis - Ichimoku Indicator Tutorial
Learn to use the Ichimoku indicator for comprehensive technical analysis, covering momentum, support, and resistance through its 5 lines. Gain insights into 11 analysis methods using Python and real-time data visualization.
Stock Market Prediction Using Regression Analysis - Python for Finance
Learn stock market prediction using Python, covering regression analysis, forecasting, and ARIMA models to guide investment decisions based on past performance.
Learning From Transaction-Level Investment Account Data
Explore machine learning techniques for analyzing transaction-level investment data, focusing on practical applications in wealth management and financial decision-making.
Interactive Brokers API and TradingView Charts in Python
Learn to integrate TradingView Lightweight Charts with Interactive Brokers API in Python. Build projects for data visualization, real-time updates, and automated trading with hands-on coding examples.
Creating Optimized Thematic Portfolios with Bloomberg Enterprise Data
Learn to build custom thematic investing tools using Bloomberg data and Databricks Platform. Explore cloud-based data management, machine learning, and visualization techniques for portfolio optimization.
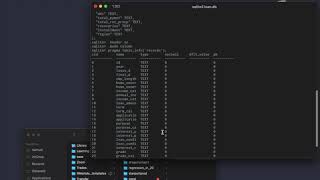
Introduction to SQLite - CSV to SQLite Import
Learn to import CSV data into SQLite databases efficiently using Python, with practical examples for financial data management in banking contexts.

Building Armada - Running Batch Jobs at Massive Scale on Kubernetes
Explore Armada: a system for massive-scale batch job execution on Kubernetes, enabling efficient utilization of GPUs and CPUs for advanced data science and machine learning in financial markets.
Perspective in 3D - Vector Math and Ray Tracing for Financial Data Analysis
Explore vector math, ray tracing, and creative engineering as Perspective's expression language is repurposed for 3D graphics, blending financial analysis with game engine concepts.

Drops for Stuff: An Analysis of Reshipping Mule Scams - USENIX Enigma 2016
Análisis de estafas de reenvío de paquetes: cómo los cibercriminales monetizan tarjetas robadas mediante reclutamiento de intermediarios inocentes para reenviar productos comprados fraudulentamente al extranjero.
Portfolio Management Using Multi-Agent Reinforcement Learning
Explore automated stock portfolio management using Deep Learning Reinforcement and innovative indicators like news sentiment scores, enhancing trading productivity and profitability.
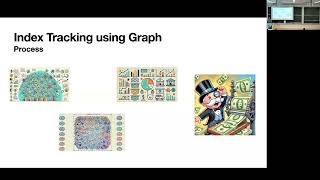
Market Graph Clustering via QUBO and Digital Annealing
Explore innovative market graph clustering techniques using QUBO and Digital Annealing, uncovering insights into complex financial networks and data structures.
Bringing Structure Into an Unstructured World - Applying State-of-the-Art Machine Learning at Digits
Explore how Digits applies transformer models to extract structured information from unstructured financial data and deploys ML experiments in production using TensorFlow.
Integrating Knowledge Graphs and Vector RAG for Efficient Information Extraction - Reading Group Session
Explore integrating knowledge graphs and vector retrieval for enhanced information extraction from unstructured financial documents, improving accuracy and efficiency in data analysis.