Power BI Desktop - Data Modeling & Interactive Visualizations
Learn data modeling and interactive visualization in Power BI Desktop. Import Excel files, build DAX formulas, create data models, and design interactive visualizations for effective data analysis and business intelligence.
Excel & Power BI Data Analysis Complete Class in One Video
Comprehensive guide to data analysis using Excel and Power BI, covering essential tools and techniques for importing, transforming, visualizing, and sharing data effectively.

Excel Data Analysis - Power Pivot, DAX Formulas, Relationships, Data Modeling & Much More
Master Power Pivot and DAX formulas for advanced Excel data analysis. Learn data modeling, relationships, and visualization techniques to create powerful reports and dashboards.
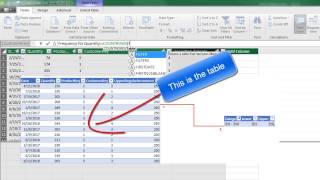
DAX Formulas for Running Total and % of Running Total & Other DAX Tricks
Master advanced DAX formulas for running totals, percentages, and data modeling in Excel. Learn to create relationships, use functions like CALCULATE and FILTER, and handle regular and irregular increments.
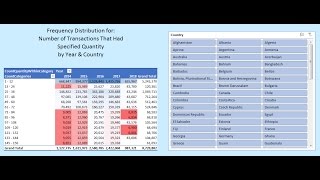
Data Model & DAX Formulas - Quantity Frequency Distribution by Year & Country
Learn to create a Data Model with DAX formulas for PivotTable frequency distributions, including conditional formatting and big data handling in Excel.
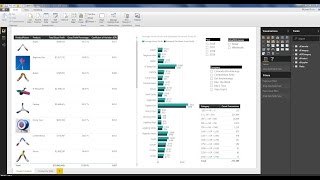
Power BI Desktop - Build Data Model, Get Data, DAX Formulas, Visualizations, Publish to Web
Comprehensive tutorial on building data models, creating DAX formulas, and designing visualizations in Power BI Desktop. Learn to import data, establish relationships, and publish interactive reports online.
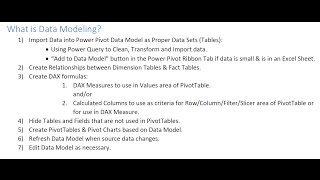
How to Build Data Model and DAX Formulas in Power Pivot
Master data modeling and DAX formulas in Power Pivot for Excel 2016. Learn to create relationships, calculated columns, and measures for powerful data analysis and visualization.
Power Pivot - Big Data, Data Modeling, DAX & Dashboards
Aprenda a modelar dados, criar fórmulas DAX e construir dashboards usando Power Pivot. Importe dados SQL, crie tabelas de datas e explore recursos avançados para análise de negócios eficiente no Excel.
Comprehensive Introduction to Excel Power Pivot, DAX Formulas and DAX Functions
Comprehensive guide to Excel Power Pivot, DAX formulas, and functions. Learn data modeling, building relationships, and creating advanced calculations for powerful business intelligence dashboards.

Hack Data Model, Date Table & DAX Measures Without Buying Power Pivot
Master advanced Excel techniques: build data models, create DAX measures, and use functions like CALCULATE and TOTALYTD. Learn to optimize PivotTables and implement variables for efficient data analysis.

Visualizing Data and Building Dashboards in Excel & Power BI
Comprehensive guide to data visualization and dashboard creation in Excel and Power BI, covering various chart types, PivotTables, Power Query, and advanced techniques for effective data presentation.