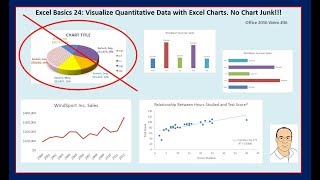
Learn to create effective Excel charts and graphs for data visualization, focusing on best practices and avoiding chart junk. Explore various chart types and their applications in data analysis.