Business Analytics for Management Decision
This course will be exclusively quantitative and an application to business/management-related problems. It is connected with problem sets and real life cases to know the relevance of a particular problem and the decision-making thereof.

Probability and Random Processes
Explore random variables, probability distributions, and stochastic processes through intuitive explanations and practical applications in parameter estimation and noisy measurements.
Risk Modelling and Survival Analysis - Actuarial Science
Explore stochastic processes, Markov chains, risk modeling, and survival analysis in actuarial science. Learn key concepts and tackle past exam questions using R for practical applications.

Python Applications for Hydrology and Hydrogeology
Learn to leverage Python for hydrological and hydrogeological data analysis, including time series analysis, data visualization, and spatial data handling. Gain practical skills for automating tasks and creating impactful visualizations.
Narrative in Five Centuries of Classical Music - Time's Arrow - Gustavo Martinez
Explore the evolution of classical music narratives across five centuries, analyzing structural complexity, temporal directionality, and the concept of irreversibility in musical compositions.
Projects in Time Series Analysis - Chaos Detection with Persistent Homology and Process Monitoring
Explore chaos detection in time series using persistent homology and process monitoring techniques, with applications in complex systems analysis and data-driven decision making.

Loss of Self-Organization in Earth's Climate
Análisis de cambios en la autorregulación del clima terrestre mediante herramientas de sistemas complejos, comparando datos de temperatura global con el modelo Daisyworld.

Spectral Factor Models and Pricing in Financial Markets - BQE Lecture
Explore financial modeling with Federico Bandi, covering spectral factor models, consumption components, and predictability in stocks and bonds, with insights on aggregation and pricing.
Social Sequence Analysis: An Introduction and Overview
Introduction to social sequence analysis: history, research applications, data sources, capabilities, limitations, and software options for analyzing event and state sequences.
Engineering Econometrics
This course will be exclusively quantitative and an application to business/management-related problems. It is connected with problem sets and real-life cases to know the relevance of a particular problem and the decision-making thereof.

Applied Statistics and Econometrics
Gain practical skills in statistical analysis and econometric modeling, enhancing your ability to interpret data and make informed economic decisions.

Advanced Data Mining with Weka
Explore advanced data mining techniques using Weka, covering time series forecasting, incremental learning, integration with R and Python, and distributed processing for big data analysis.
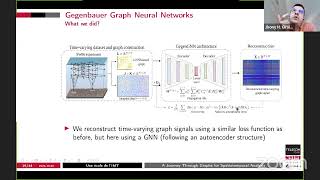
A Journey Through Graphs for Spatiotemporal Analysis
Embark on a comprehensive exploration of graph-based techniques for spatiotemporal analysis in this illuminating webinar from the IEEE Signal Processing Society's DEGAS series. Delve into the fascinating world of graph theory and its applications in anal…

Realtime Streaming for Anomaly Detection - An End-to-End Data Engineering Project
Build a real-time anomaly detection system using streaming data engineering techniques. Learn end-to-end implementation for monitoring and identifying unusual patterns in data streams.
Machine Learning on Dynamic Graphs - Temporal Graph Networks
Explore Temporal Graph Networks for dynamic graph analysis, unlocking insights in evolving systems like social networks and financial transactions.
Dynatrace Dashboard Updates - January 2024
Explore new Dynatrace Dashboard App features through a live demo, including advanced threshold visualization, sparkline for timeseries, and enhanced unit formatting.
Deep End-to-end Causal Inference and Introduction to Causal Discovery
Explore deep end-to-end causal inference and discover its applications in data-driven decision-making across various domains. Learn about causal discovery, inference, and the Microsoft causal AI suite.

Time Series Machine Learning for Deployment in Healthcare
Explore time series machine learning applications in healthcare, focusing on ICU data analysis, explainability tools, and real-time evaluation for improved patient outcomes.
Actionable Dashboarding - Dynatrace Update April 2023
Explore Dynatrace's latest dashboarding innovations, compare classic and new Dashboard App, and learn migration strategies. Gain insights on choosing the right tool for your observability data visualization needs.
ParadeDB - Postgres for Search and Analytics
Explore ParadeDB's integration of search and analytics capabilities into PostgreSQL, enhancing database functionality for modern applications.
Temporal Network Embedding Using Classical Multidimensional Scaling
Explore temporal network embedding techniques using classical multidimensional scaling for advanced data analysis and visualization.