Deep Learning Full-Cycle Projects - Lecture 3
Comprehensive exploration of full-cycle deep learning projects, covering project selection, visualization, and problem-solving techniques for voice-activated devices and network challenges.
Harnessing Data for Social Impact - Empowering Communities through Visualization and Social Computing
Explore innovative tools combining visualization, HCI, and AI to empower communities in addressing complex societal issues like urban planning and climate change, fostering inclusive decision-making.
Human-Machine Symbiosis in Data Visualization
Exploring human-machine configurations for data visualization tasks, focusing on interactive analysis of event sequence data and visualization authoring through manipulable semantic components.

Statistics Fundamentals
Comprehensive overview of statistical concepts, from basic distributions to advanced topics like maximum likelihood, providing a solid foundation for data analysis and interpretation.

Data Analysis with Python 3 and Pandas
Learn Python data analysis using Pandas: visualization, grouping, correlation, dataset merging, and machine learning with Scikit-learn for practical data science skills.
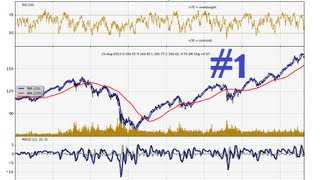
Customizing Matplotlib Graphs and Charts
Learn to create advanced stock and forex charts using Python and Matplotlib, covering data retrieval, technical indicators, and customization for effective financial analysis.
Data + Art - Better Science Communication
Explore data visualization through art with Kirell Benzi, enhancing science communication. Learn innovative techniques to present complex information visually and engage audiences effectively.

Data Art and the Future of Science Communication
Explore data art's role in science communication with Kirell Benzi. Learn how visual representation enhances understanding, bridges disciplines, and shapes the future of scientific dissemination.
Text-Based Timeline Analysis and New Instruments for the Science of Stories
Exploring Twitter data as a telescope for observing collective human thought, revealing insights into sentiment, narrative power, and social dynamics through innovative text analysis techniques.
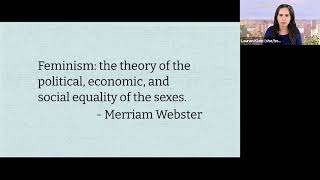
What Is Feminist Data Science? - Incorporating Feminist Thinking into Data-Driven Research
Explore feminist data science principles and their application in humanities research, including case studies on women's invisible labor, Black activism, and innovative data visualization techniques.
Upping Your Data Viz Game - Effective Storytelling and Visualization Techniques
Enhance data visualization skills with storytelling techniques, effective color usage, and uncertainty representation. Learn from expert insights to create impactful and informative visual presentations.
The Counting Project - How Data Built the Modern World
Explore how data shaped our world and its potential to create a better future with economist Tim Harford in this insightful inaugural lecture honoring Vicky Neale's contributions to mathematics education.
Social Sequence Analysis: An Introduction and Overview
Introduction to social sequence analysis: history, research applications, data sources, capabilities, limitations, and software options for analyzing event and state sequences.

Dashboarding with Notebooks
Learn Dashboarding with Notebooks with Kaggle! In this course, you will learn about what information to include, best practices for making dashboards, running notebooks with Kaggle API, scheduling notebook runs using cloud services, and testing and valid…
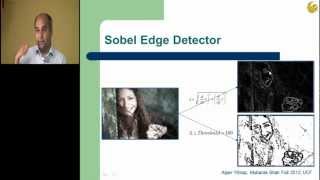
Filtering in Computer Vision - Lecture 2
Learn about image filtering techniques, including noise reduction, edge detection, and smoothing. Explore applications in computer vision and gain hands-on experience with MATLAB functions for image processing.
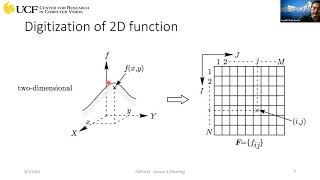
CAP5415 - Digital Image Processing: Filtering and Noise Reduction - Lecture 3
Explore image processing fundamentals, including digitization, histograms, noise types, and filtering techniques. Learn about derivatives, averages, and correlation in the context of digital image analysis.
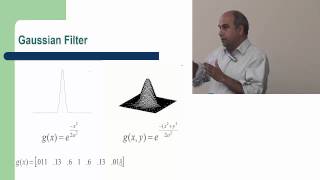
Filtering in Computer Vision - Lecture 2
Learn about image filtering techniques, including noise reduction, derivatives, convolution, and Gaussian filters. Explore practical applications in computer vision using MATLAB.
Data Mining with Weka
Learn data mining techniques using Weka software. Explore datasets, build classifiers, visualize data, and understand key concepts like cross-validation, overfitting, and ensemble learning.
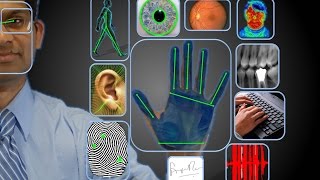
Intro to Digital Image Processing Lectures, Spring 2015
Comprehensive exploration of digital image processing techniques, from fundamentals to advanced topics. Covers acquisition, manipulation, analysis, and applications of digital images across various domains.
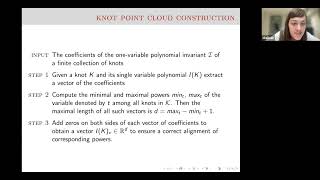
The Shape of Relations: Knots and Other Stories in Topological Data Analysis
Explore the fascinating world of Topological Data Analysis in this 59-minute conference talk by Radmila Sazdanovic, presented by the Applied Algebraic Topology Network. Discover how TDA tools can uncover relevant features in data by analyzing the shape o…

Indispensable Principles of Crafting Complex Interfaces
Master the art of designing data-dense digital products for expert users, transforming complex interfaces into efficient, user-friendly tools.