
ChatGPT Code Interpreter - A New Era of Data Science Begins
Explore ChatGPT's Advanced Data Analysis feature for data analysis, image processing, and code editing. Learn to leverage this tool for various tasks using real-world examples.

Tableau Full Course - Learn Tableau in 6 Hours
Tableau is the most widely used data visualization tool in the world. This Great Learning Tableau Tutorial will help you explore all the fundamental Tableau topics and master them.

Data Analytics Using Excel
Master Excel for data analytics: clean, analyze, and visualize data using functions, pivot tables, and charts. Gain practical skills for data-driven decision-making and career advancement.

Complete Python Playlist
Comprehensive guide to Python programming, covering basics to advanced topics, data science libraries, and practical projects for becoming an expert developer.
Tableau Tutorials for Beginners
Learn to create visualizations, use calculated fields, build maps and graphs, perform joins, and complete a full project in this comprehensive beginner's guide to Tableau.
Microsoft Excel
Master Excel essentials: data handling, formatting, graphing, and problem-solving tools. Learn through practical examples and case studies to enhance your spreadsheet skills for various applications.

Microsoft Excel Tutorial - Beginners Level 4
Learn advanced Excel techniques including conditional formatting, data validation, drop-down menus, and slicers to enhance data analysis and visualization skills.

Seaborn Tutorial
Comprehensive tutorial on Seaborn data visualization library, covering various plot types, styling options, and real-world examples for effective data representation and analysis.
Neo4j APOC Utility Library How-To Series
Learn to leverage Neo4j's APOC library for efficient graph database operations, from data loading and manipulation to model refactoring and visualization enhancements.
Monte Carlo Simulation with Python
Learn to implement Monte Carlo simulations in Python, exploring various betting strategies and analyzing results through statistical methods and data visualization.

Power BI Master Tutorial
Master data processing and visualization with Power BI. Learn to build queries, prep data, create relationships, and develop interactive dashboards. Gain skills in advanced analytics, AI visuals, and custom visualizations.
How to Improve Visibility in Kubernetes with Prometheus, Grafana, and NGINX
Enhance Kubernetes monitoring using NGINX, Prometheus, and Grafana. Learn to leverage dashboards, export metrics, and create visualizations for improved visibility and performance tracking in microservices environments.

Sustaining India’s Hidden Water Resource
Empowering villagers as groundwater champions through training, capacity building, and technology like MyWell App for sustainable groundwater management in India.

Explore the Sports Broadcast and Motion Graphics Sample - Webinar
Discover how to create dynamic sports broadcast graphics using Unreal Engine, from customizable templates to live operation and batch rendering techniques.
Statistics for Data Science
Comprehensive exploration of statistical concepts for data science, covering descriptive and inferential statistics, probability distributions, hypothesis testing, and various analytical methods through practical examples.
Data Visualization Using Tableau
Learn Tableau for powerful data visualization: from basics to advanced techniques, including dashboards, graphs, and real-world dataset analysis.

Qlik Sense Tutorial - Beginner to Advanced Training
Comprehensive Qlik Sense training covering basics to advanced topics. Learn data loading, visualization creation, app publishing, variables, dynamic loading, scripting, and more. Ideal for beginners and experienced users.
Building Data Apps With a Codeless Approach - Build Data Apps Using KNIME Low-Code/No-Code
Learn to create interactive data apps using KNIME's low-code/no-code approach. Discover how to build, visualize, and deploy analytics solutions with user-friendly interfaces for end-users to gather insights effortlessly.

Tableau for Beginners in Hindi - Tableau Training for Beginners - Tableau Tutorial
Great Learning brings you this video “Tableau in Hindi”, aimed at helping you understand concepts involving business intelligence, data visualization, and tableau.
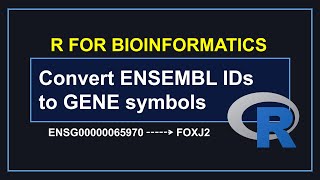
R for Bioinformatics
Learn to convert Ensembl IDs to gene symbols and create heatmaps using R packages like biomaRt and pheatmap, essential skills for bioinformatics data analysis and visualization.
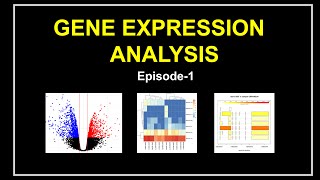
Transcriptomics
Comprehensive guide to RNA-Seq analysis, covering data processing, visualization techniques like volcano plots and heatmaps, and practical applications using R and Galaxy.