
Introduction to Statistics in Data Science
Comprehensive introduction to key statistical concepts in data science, covering population, sampling, variables, measurement scales, and data visualization techniques.
Kubernetes Observability Stack - How to Use TOBS with Linode LKE
Learn to deploy and use TOBS (The Observability Stack) on Linode Kubernetes Engine, exploring key monitoring tools like Prometheus, Grafana, and TimescaleDB for enhanced cluster observability.
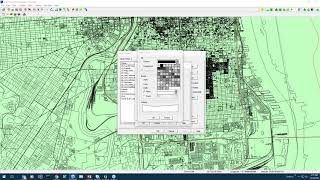
FiberBase V6.1 Working With Map Layers
Learn to manage map layers in FiberBase V6.1: create TAB files, load static and FiberBase data, arrange layers, and control visibility and selectability for efficient fiber network mapping.
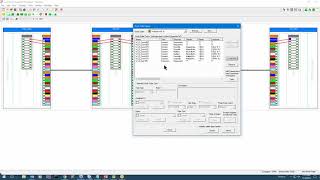
FiberBase New Features
Explore FiberBase V6.1's new features, including work order management, project views, Android integration, map exports, and enhanced workspaces for improved fiber network management efficiency.
How Sensor and Social Networks Enable Adaptive Water Management
Explore adaptive water management through sensor and social networks, focusing on improved outcomes in irrigation communities and government cooperation.
Using Chart.js with React
Learn to integrate Chart.js with React, creating dynamic and interactive charts in your web applications. Covers installation, components, data handling, and API integration.

Data Driven Maps With Python Folium & Leaflet.js
Learn to create interactive maps using Python Folium and Leaflet.js. Covers markers, geojson overlays, choropleths, and data integration for powerful data-driven visualizations.
Inside TensorFlow - Summaries and TensorBoard
Explore TensorBoard and tf.summary API for data visualization in TensorFlow. Learn about API changes, log directories, event files, and best practices from a TensorFlow engineer.

TensorFlow Extended - TFX Overview and Pre-Training Workflow
Explore TensorFlow Extended's pre-training workflow, focusing on data validation and transformation for robust machine learning pipelines. Learn key components and best practices for efficient ML development.

Visualization for Machine Learning - Google Brain
Explore data visualization techniques for machine learning, including high-dimensional data, multilingual systems, and language models, with insights on biases and user intent.
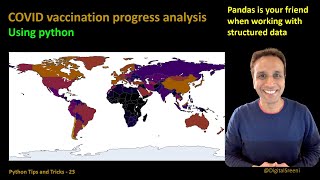
COVID Vaccine Analysis Using Pandas in Python
Analyze COVID vaccination data using pandas in Python, covering data reading, daily and overall analysis, and visualization with Plotly.
Sedimentology Futures - Geoheritage, Planetary Exploration, and Technology
Explora el futuro de la sedimentología: geopatrimonio, exploración planetaria y tecnología. Descubre cómo estos campos interconectados están transformando la investigación y abriendo nuevas fronteras en la ciencia sedimentológica.

Building Websites with Python Using Streamlit - A Comprehensive Guide
Master Python web development with Streamlit by building interfaces using forms, charts, and advanced features. Create dynamic websites quickly while learning data flow, session management, and multi-page applications.
RAG: GraphRAG - Visualización del Knowledge Graph en Neo4J
Descubre cómo cargar y visualizar un Knowledge Graph creado con GraphRAG en Neo4J, explorando técnicas avanzadas de representación del conocimiento para ciencia de datos y aprendizaje automático.
R Tutorial for Beginners
Aprenda R desde cero: instalación, conceptos básicos, estructuras de datos, gráficos y estadísticas. Tutorial completo en hindi para principiantes con ejemplos prácticos.

Matplotlib & Seaborn 入門講座
Pythonでデータ可視化をマスター。Matplotlib & Seabornを使って、折れ線、棒、円グラフなど多様なグラフ作成技術を学び、実践的なデータ分析スキルを身につける。
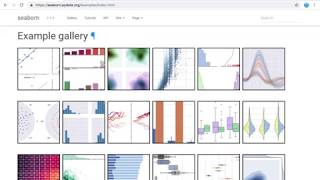
파이썬 Python Seaborn 으로 시각화 하기
Seaborn을 활용한 데이터 시각화 기법 학습: 다양한 그래프 유형, 시계열 데이터 처리, 통계 분석 시각화, 서브플롯 생성 등 실용적인 기술 습득
Python Ile Grafik Dersleri Veri Görselleştirme Matplotlib & Seaborn & Pandas
Python ile veri görselleştirme: Matplotlib, Seaborn ve Pandas kütüphaneleri kullanarak çizgi, saçılım, bar, histogram ve yoğunluk grafikleri oluşturmayı öğrenin. Veri bilimi ve analiz için temel beceriler kazanın.
Matplotlib Python Tutorial in Hindi
Learn to create various graphs and visualizations using Matplotlib in Python, from basic line plots to advanced data visualization techniques. Hands-on examples and practical applications included.
Python Matplotlib Tutorial in Hindi
मशीन लर्निंग के लिए Matplotlib लाइब्रेरी का व्यापक हिंदी ट्यूटोरियल। विभिन्न प्रकार के प्लॉट्स बनाना, सबप्लॉट्स, और चित्र सहेजना सीखें।

Belajar Matplotlib Bahasa Indonesia
Panduan lengkap membuat visualisasi data dengan Matplotlib di Python, mencakup instalasi, pengaturan warna, label, sumbu, dan fitur lanjutan untuk plot yang informatif.