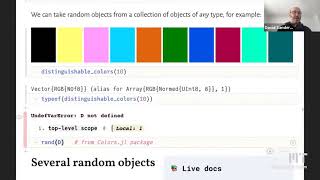
Sampling and Random Variables in Julia - Lecture 9
Explore random sampling, probability distributions, and data visualization techniques using Julia, covering topics from basic coin tosses to complex probability densities and histogram normalization.
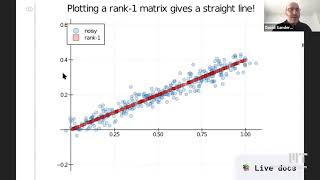
Principal Component Analysis - Lecture 8
Explore Principal Component Analysis: from matrix rank to SVD. Learn to measure data cloud size, understand correlated data, and navigate high-dimensional spaces using statistical techniques.
Introduction to Arrays and Images in Computational Thinking - Lecture 1
Explore computational thinking through image manipulation and array operations in Julia, with hands-on examples and an introduction to abstraction concepts.
Data Wrangling Techniques in Julia - Part 2 - Tom Kwong
Explore advanced data wrangling techniques in Julia, covering reading, cleaning, tidying, analyzing, and visualizing data using two sample datasets for practical application.
Data Wrangling Techniques in Julia - Part 1 - Tom Kwong
Comprehensive overview of data wrangling in Julia, covering ecosystem, workflow stages (read, clean, tidy, analyze, visualize), and DataFrames.jl resources for effective data science practices.
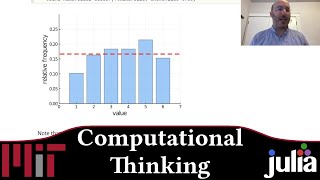
Probability via Computation - Week 4
Explore probability concepts through computational methods, covering random sampling, Monte Carlo simulations, Bernoulli trials, and the Central Limit Theorem with practical examples and visualizations.
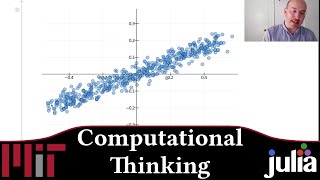
Understanding Structure in Data - Week 3
Explore data structure analysis using Julia, covering matrix rank, data visualization, PCA, and building a simple recommendation engine. Gain practical insights into advanced data science concepts.
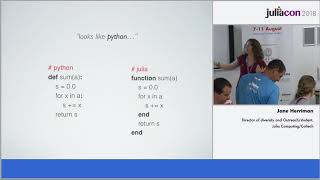
An Introduction to Julia for Beginners
Comprehensive introduction to Julia programming, covering basics to advanced topics. Ideal for beginners with technical computing needs and experience in other languages.
Advanced Tableau Training - Expert Course for Tableau Desktop
Master advanced Tableau Desktop techniques including parameters, LOD expressions, spatial functions, geospatial charts, and table calculations to enhance data analysis and visualization skills.
Ten Excel Tips That Are Easy to Learn - Part 2
Learn 10 essential Excel skills including macros, named ranges, page breaks, heat maps, and pie charts to enhance your spreadsheet proficiency and productivity.

How to Build Interactive Excel Dashboards
Learn to create interactive Excel dashboards for effective data visualization. Master calculations, charts, graphs, and formatting techniques to design impactful dashboards. Includes practical exercises and downloadable files for hands-on learning.
Create Microsoft Excel Pivot Charts and Map Charts
Learn to create and format Pivot Charts and Map Charts in Excel 2021/365. Master data visualization techniques, explore chart types, and practice with downloadable exercise files.
Excel Tips and Tricks for Beginners
Learn essential Excel skills including dark mode, formatting, cell manipulation, error handling, and data protection in this comprehensive tutorial for beginners and intermediate users.
Excel 2021 Pivot Tables Tutorial
Master Excel Pivot Tables to efficiently analyze large datasets, create insightful reports, and design powerful charts. Learn data organization, custom sorting, and advanced functions like XLOOKUP and Power Pivot.
Google Sheets for Excel Users Tutorial
Accelerated training for Excel experts to master Google Sheets, covering advanced features like conditional formatting, real-time collaboration, interactive forms, financial data integration, and automation through macros.
Excel 2019 - Intro to Data Analysis Tutorial
Learn essential data analysis techniques in Excel 2019, including table formatting, conditional functions, charting, and pivot tables. Gain skills to effectively analyze, summarize, and visualize your data.

Visualizations in Power BI - Full Tutorial
Comprehensive tutorial on Power BI visualizations, covering tables, charts, formatting, and interactive elements. Learn to create impactful data presentations and enhance report design for effective business intelligence.
Creating a Power BI Report - Detailed Power BI Tutorial
Learn to design Power BI reports with titles, navigation, visualizations, and charts. Master card filtering, line charts, stacked columns, and treemaps for effective data representation.

Microsoft Power BI for Beginners - Power BI Crash Course
Learn Power BI essentials: data import, transformation, modeling, DAX, visualizations, and publishing. Master key features for effective business intelligence and data analysis in just two hours.

How to Create a Stunning Interactive Dashboard in Excel - Sales Excel Dashboard Crash Course
Step-by-step guide to creating an interactive sales dashboard in Excel, covering data setup, calculations, dynamic charts, and advanced features for a comprehensive and visually appealing analysis tool.
Concept Clearance - Analysis, Visualization and Informatics Lab-Space - AnVIL
Explore AnVIL's genomic data sharing platform, clinical research support, and cloud computing solutions. Learn about program renewals, key components, and future developments in this informative presentation.