
Forex Trading Techniques
Improve Forex trading results with advanced techniques, chart analysis, and risk management strategies. Learn entry/exit methods, position sizing, and algorithmic trading for successful outcomes.
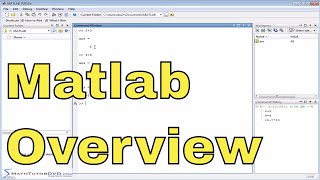
Matlab Tutorial
Comprehensive guide to MATLAB, covering user interface, arithmetic, variables, complex numbers, vectors, matrices, calculus, and plotting. Ideal for beginners and intermediate users.
Excel Charts
Learn to create dynamic, visually appealing Excel charts and graphs. Master techniques for Gantt charts, map charts, variance analysis, and data visualization to enhance your reporting and analysis skills.
Excel Infographic Chart Templates
Learn to create eye-catching infographics and unique visualizations in Excel, from dynamic maps to sales funnels, using creative chart techniques and templates for impactful data presentation.

Excel - What If Analysis
Learn powerful Excel tools for data analysis, including sensitivity analysis, goal seek, scenario manager, and Solver add-in for optimizing complex problems.

Growth Insights
Discover cutting-edge growth hacking tools, techniques, and strategies for digital marketing success. Learn about AI, automation, social media, data visualization, and more to boost your business growth.

Data Interpretation Series - Basic to Advance
Comprehensive data interpretation training for competitive bank exams, covering various graph types and offering fast-solving techniques to enhance performance in prelims and mains.
Beginner's Crash Course to Elasticsearch and Kibana
Learn Elasticsearch and Kibana basics through short videos covering key concepts, operations, queries, and data visualization techniques for developers new to these powerful tools.

Matplotlib Tutorial
Learn to create and customize various data visualizations using Python's Matplotlib library, from basic plots to real-time data representation and subplots.
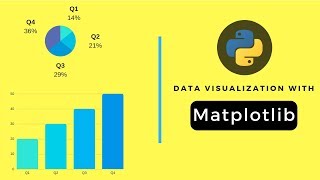
Data Visualization with Matplotlib for Beginners
Learn to create diverse, professional-looking visualizations using Matplotlib, from installation to advanced techniques like annotations and style sheets.

NumPy Data Science Essential Training With Python 3
Master NumPy for data science: arrays, indexing, computation, visualization, and statistical analysis. Hands-on practice with Python 3 and Jupyter Notebook for real-world applications.
Data Analytics with Python
Learn data analytics using Python, covering preprocessing, visualization, machine learning algorithms, and practical examples. Gain skills to analyze datasets, make predictions, and compete on Kaggle.

Data Visualization GUIs with Dash and Python
Learn to create interactive data visualization interfaces using Dash and Python, covering dynamic graphs, live updates, sentiment analysis, and app deployment for effective data presentation.
Dash Bootstrap
Learn to create interactive dashboards using Dash Bootstrap, covering styling, components, and advanced features for data visualization and user interaction.

Plotly Dash Components
Explore Plotly Dash components for interactive data visualization. Learn to create dropdowns, sliders, graphs, and more for building dynamic web applications with Python.

D3 Tutorial - The Basics
Learn D3.js basics: selecting elements, appending to the page, joining data, and controlling SVG shapes dynamically. Covers SVG fundamentals and data handling in D3.

Table Filter and Charts Add-on - Real Cases
Learn to leverage Table Filter and Charts add-on with various Confluence tools for enhanced data visualization and analysis.

Working with Table Filter for Confluence Add-On
Learn to manage various filter types, create pivot tables and dynamic charts, and export data using the Table Filter add-on for Confluence, enhancing data visualization and analysis.
Working With Tables in Confluence
Enhance Confluence tables with filtering, aggregation, and visualization techniques. Learn to create charts, use macros, and leverage advanced features for improved data presentation.
OSINT Tips
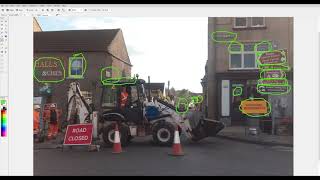
Quick, easy-to-watch videos teaching Open Source Intelligence (OSINT) skills and techniques, covering topics like geolocation, social media analysis, data scraping, and Linux terminal skills.
RS-GIS Data Download
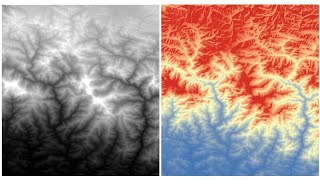
Learn to download and process various geospatial datasets, including DEMs, climate data, soil maps, satellite imagery, and more. Gain skills in data acquisition and preparation for GIS analysis.