More Inverse Kinematics and Texturing Cloth Simulation
Explore advanced inverse kinematics techniques and learn to texture 3D cloth simulations in Processing. Gain hands-on experience with multiple snake models, fixed points, and meshed cloth texturing.
Forward and Inverse Kinematics
Explore forward and inverse kinematics, create tentacle-like creatures, and learn about polar coordinates in this interactive coding session with hands-on challenges and community showcases.
3D Earthquake Data Visualization and Steering Behaviors
Explore 3D earthquake data visualization and steering behaviors in coding. Learn advanced techniques, see community projects, and engage in live Q&A with an experienced instructor.
Coding Challenges - Circle Packing and White House Data Visualization
Explore circle packing algorithms, visualize White House social media data, and create photo mosaics in this coding livestream. Learn to animate 2D space filling with non-overlapping circles of various sizes and colors.
The Coding Train Morning Show - Marching Squares and Flocking Mewchoo
Explore Marching Squares, community contributions, and 3D modeling in Processing. Learn about flocking algorithms and their application to 2D and 3D environments, with a focus on the "Mewchoo" model.
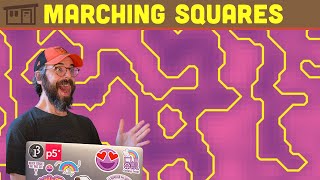
Coding in the Cabana - Marching Squares
Explore the Marching Squares algorithm and its application to Open Simplex Noise in Processing, covering 2D grid creation, isoline visualization, and noise-based point generation.
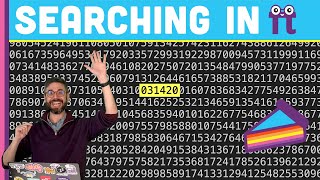
Peeking Inside Pi
Build a web app to search the first billion digits of Pi using p5.js and Node.js. Learn to handle large datasets, create APIs, and implement efficient search algorithms.

D3.js Continued with Shirley Wu
Dive deeper into D3.js with Shirley Wu, exploring advanced concepts, answering questions, and refining the Film Flowers project. Learn from an award-winning creative's expertise in data visualization.

Introduction to D3.js with Shirley Wu
Learn data visualization with D3.js from expert Shirley Wu. Create interactive, artistic visualizations using SVG, data importing, and D3's enter-update-exit pattern to bring your data to life.

RDP Algorithm
Explore the Ramer-Douglas-Peucker algorithm for simplifying curves in this interactive coding session, featuring live demonstrations, community contributions, and practical applications.

Python Pandas Tutorial - Reading-Writing Data to Different Sources - Excel, JSON, SQL, Etc
Learn to import and export data from CSV, JSON, Excel, SQL, and more using Python Pandas. Master essential data handling techniques for various file formats in data science.

Python Pandas Tutorial - Grouping and Aggregating - Analyzing and Exploring Your Data
Learn to group and aggregate data in Python Pandas, exploring techniques like value counts, multiple aggregates, and practice questions to analyze datasets effectively and answer complex queries.
Covid 19 Data Analysis
Learn to analyze COVID-19 data using professional data science tools. Covers web scraping, data manipulation, and visualization techniques to extract insights from reliable sources.

Plotly Tutorial
Comprehensive tutorial on Plotly for data visualization, covering various chart types, styling options, and advanced features like 3D plots, maps, and animations.

Matplotlib Tutorial
Comprehensive tutorial on Matplotlib, covering various plot types, customization options, and integration with Pandas. Ideal for data visualization in Python.

Pandas Tutorial
Comprehensive guide to Pandas framework for data manipulation, analysis, and visualization, covering key concepts and practical examples for effective data science workflows.
NumPy Tutorial
Comprehensive guide to NumPy: from array creation and manipulation to advanced mathematical operations, file handling, and specialized functions for data science and scientific computing.
Statistics for Data Science & Machine Learning
Comprehensive overview of statistical concepts for data science and machine learning, covering fundamental principles, probability distributions, hypothesis testing, regression analysis, and more.
Probability for Data Science & Machine Learning
Comprehensive overview of probability concepts for data science and machine learning, covering key formulas and real-world applications in a concise, accessible format.
R Programming Tutorial
Comprehensive tutorial covering R programming basics, data manipulation, visualization, and statistical analysis. Ideal for beginners seeking hands-on learning with practical examples and applications.

How I Make Beautiful Graphs and Plots Using LaTeX
Learn to create professional-quality graphs and plots using LaTeX and pgfplots, covering 2D and 3D visualizations, customization techniques, and data importing for enhanced scientific and mathematical presentations.