
Tableau Full Course - Learn Tableau in 6 Hours
Tableau is the most widely used data visualization tool in the world. This Great Learning Tableau Tutorial will help you explore all the fundamental Tableau topics and master them.
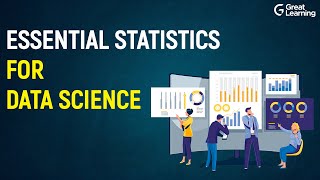
Essential Statistics for Data Science - Learn Statistics for Data Science
Comprehensive overview of essential statistics for data science, covering central tendency, hypothesis testing, ANOVA, and more. Ideal for aspiring data scientists seeking foundational knowledge.

Data Analytics Using Excel
Master Excel for data analytics: clean, analyze, and visualize data using functions, pivot tables, and charts. Gain practical skills for data-driven decision-making and career advancement.
Splunk Fundamentals 1
Learn to navigate Splunk, create reports and dashboards using search commands and Pivot tool. Covers installation, data ingestion, configuration, lookups, alerts, and key commands.

Complete Big Data
Learn Big Data fundamentals, Hadoop setup, Linux basics, scaling concepts, and HDFS architecture in this comprehensive tutorial series for beginners and professionals.

Complete Python Playlist
Comprehensive guide to Python programming, covering basics to advanced topics, data science libraries, and practical projects for becoming an expert developer.
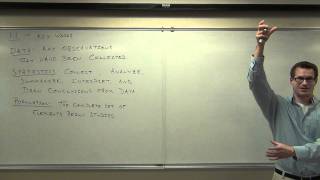
Statistics
Comprehensive video series covering fundamental statistical concepts, from data analysis to hypothesis testing, with practical examples and in-depth explanations.

Business Economics
Comprehensive overview of business economics, covering demand, supply, elasticity, forecasting, market structures, and break-even analysis. Ideal for competitive exam preparation and understanding core economic concepts.
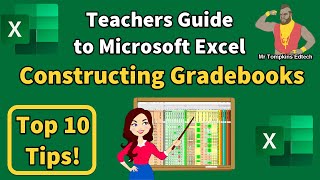
Microsoft Excel - A Teachers Guide to Creating Dynamic Gradebooks-E-Markbooks
Learn to create dynamic gradebooks in Excel with features like named ranges, VLOOKUP, XLOOKUP, and student summary pages. Perfect for teachers seeking efficient grading solutions.
Tableau Tutorials for Beginners
Learn to create visualizations, use calculated fields, build maps and graphs, perform joins, and complete a full project in this comprehensive beginner's guide to Tableau.
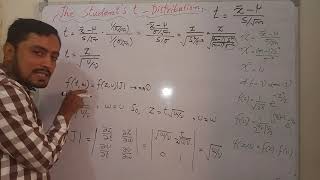
The Student's t-Distribution
Explore the Student's t-Distribution, its methods, and applications in statistical analysis for more accurate inferences from small sample sizes.
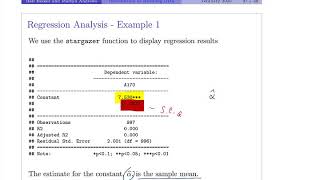
Quantitative Methods
Explore regression analysis and difference-in-differences methodology using R, with a focus on the Minimum Legal Drinking Age example.
Microsoft Excel
Master Excel essentials: data handling, formatting, graphing, and problem-solving tools. Learn through practical examples and case studies to enhance your spreadsheet skills for various applications.
Reproducible Data Science with Machine Learning
Discover techniques for reproducible data science using machine learning, focusing on workflow organization, notebook environments, and Azure ML Compute Instances for transparent and explainable AI development.

Vue JS Crash Course
Master Vue.js fundamentals through hands-on projects. Build a task tracker and user generator, explore components, events, routing, and backend integration for practical web development skills.

Microsoft Excel Tutorial - Beginners Level 4
Learn advanced Excel techniques including conditional formatting, data validation, drop-down menus, and slicers to enhance data analysis and visualization skills.

Seaborn Tutorial
Comprehensive tutorial on Seaborn data visualization library, covering various plot types, styling options, and real-world examples for effective data representation and analysis.
Power BI Desktop - Data Modeling & Interactive Visualizations
Learn data modeling and interactive visualization in Power BI Desktop. Import Excel files, build DAX formulas, create data models, and design interactive visualizations for effective data analysis and business intelligence.
Calculate DAX Function and Filter Context - ALLSELECTED and KEEPFILTERS
Comprehensive tutorial on CALCULATE DAX function, filter context, and related concepts in Power BI and Excel Power Pivot. Covers 50 examples with in-depth explanations of advanced DAX techniques.
The Magic of Excel - Formulas, PivotTables, Charts, Flash Fill, Sort, Filtering, Functions & More
Discover Excel's powerful features: formulas, PivotTables, charts, and more. Learn essential skills to boost efficiency and data analysis capabilities for work, school, and personal projects.
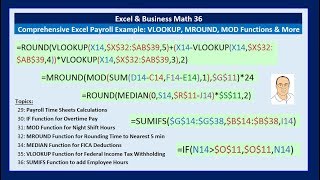
Comprehensive Excel Payroll Example - SUMIFS, MROUND, MOD, VLOOKUP & More
Comprehensive payroll solution using advanced Excel functions like SUMIFS, MROUND, MOD, and VLOOKUP. Learn to calculate hours, deductions, and taxes efficiently.