Neo4J Knowledge Graph Builder - Introduction to RAG and LLM Integration
Explore Neo4J Knowledge Graph Builder for creating knowledge graphs from unstructured data using LLMs and LangChain. Learn to leverage this tool for advanced data science and machine learning applications.

Devices and Data: An Overview of Over-the-Counter Medical Devices
Explore the world of "over the counter" medical devices and their impact on cardiovascular health with insights from Dr. Joe Jensen.

Courant, Bezout, and Persistence in Spectral Geometry - Lecture 1
Explore spectral geometry and topological persistence, focusing on oscillation of functions, Courant's nodal domain theorem, and Bezout's theorem in the context of eigenfunctions.

DIY AI: Build and Train Your Own Model with PyTorch
Dive into building and training a custom AI model using PyTorch, Python, and Jupyter Labs. Learn step-by-step techniques to create a deployable model for Raspberry Pi or other computers.
Langchain: Integration of ElasticSearch Vector Store and RAG with Gemini
Explore integrating Langchain with ElasticSearch for RAG applications, using ElasticSearch as a vector store and retrieval component with Gemini.

UGC NET Paper 1- Crash Course - From Zero to Hero
Comprehensive crash course covering all topics for UGC NET Paper 1 exam, including teaching aptitude, research methodology, and logical reasoning. Ideal for quick and effective preparation.

Python Web Scraping Tutorial
Learn to extract data from websites using Python, BeautifulSoup, and Scrapy. Master HTML parsing, error handling, and site crawling techniques for efficient web scraping projects.
Python Web Scraping - Beautiful Soup
Learn Python web scraping with Beautiful Soup: extract data from websites, download images, and gather information from various sources like college sites, Google blogs, TED talks, and e-commerce platforms.
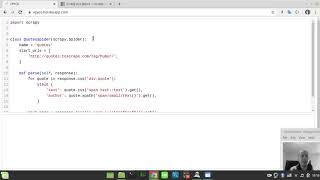
Scrapy Tutorials
Learn to extract, process, and store web data efficiently using Scrapy. Covers basic to advanced techniques, real-world projects, and best practices for web scraping.

Scrapy for Beginners
Learn powerful web scraping with Scrapy: master selectors, spiders, and data extraction techniques. Ideal for beginners seeking to automate data collection from websites efficiently.
Visualization With Seaborn
Learn to create powerful data visualizations using Seaborn, covering joint kernels, heatmaps, swarm plots, and more. Enhance your Python graphing skills with this comprehensive tutorial.
Seaborn- Understanding the Weird Parts
Explore advanced data visualization techniques using Seaborn, covering various plot types and statistical analyses for effective data representation and insights.
Python Seaborn Complete Tutorial for Beginners
Master data visualization with Python's Seaborn library. Learn to create scatter plots, line charts, box plots, and more through step-by-step tutorials and practical examples.

Intro to Seaborn
Comprehensive video series on Seaborn data visualization library, covering various plot types, styling options, and advanced features for effective data representation in Python.
Seaborn Python Tutorial
Learn data visualization with Seaborn: create scatter plots, line charts, and distribution plots. Master regression models, FacetGrid, and color palettes for effective data analysis and presentation.

Machine Learning with Scikit-Learn
Hands-on introduction to machine learning using Scikit-Learn and Python, covering key algorithms, preprocessing techniques, and feature selection for practical implementation.
Plotly Graphs
Learn to create interactive and visually appealing data visualizations using Plotly in Python, from basic charts to advanced techniques and deployment.

Connecting Plotly Graphs to Dash Components
Learn to create interactive data visualizations by connecting Plotly graphs with Dash components. Master various chart types and enhance user interaction in your Python-based dashboards.

Plotly Dashboards
Learn to create interactive dashboards and data visualizations using Plotly and Dash. Master various chart types, components, and styling techniques for building powerful web applications with Python.
Develop Dashboard for Business Intelligence & Data Science - Plotly Dash Tutorial Series
Learn to create interactive, secure, and deployable dashboards using Plotly Dash for data science and business intelligence applications.

Data Visualization Using Plotly for Python
Learn to create interactive and visually appealing data visualizations using Plotly for Python, covering various chart types and techniques for effective data representation.