Sports Analytics
Explore sports analytics through diverse projects, data scraping, and statistical analyses. Learn to predict outcomes, simulate games, and gain insights into various sports using data science techniques.

Google Sheets Advanced Tutorial
Master advanced Google Sheets techniques: data sorting, filtering, charts, pivot tables, functions (IF, VLOOKUP, SUMIF), macros, and more. Enhance your spreadsheet skills for efficient data analysis and visualization.
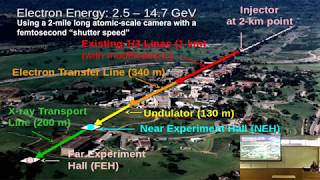
Data Analytics at the Exascale for Free Electron Lasers Project
Innovative data system architecture for LCLS-II upgrade, addressing high-throughput challenges with real-time analysis, fast feedback, and data reduction while preserving scientific content.
Quantitative Finance
Comprehensive exploration of financial modeling, risk analysis, and investment strategies, equipping learners with advanced tools for data-driven decision-making in the financial sector.

Astrophysics & Cosmology
Explore the wonders of the universe through comprehensive lectures on celestial bodies, cosmic phenomena, and the fundamental laws governing our cosmos.
Plotly Dash Complete Tutorial
Learn to create interactive dashboards and data-intensive applications with Plotly Dash. Master various components, charts, and styling techniques for building powerful web applications using Python.

Matlab Tutorial
Learn MATLAB basics for data analysis, control systems, and signal processing. Covers variables, operations, scripts, functions, and linear algebra in a beginner-friendly tutorial.
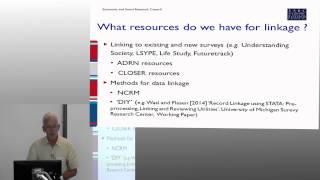
Data Quality and Data Management
Explore data linkage's societal impact, ethical considerations, and practical applications across the UK, with insights on civil liberties and available datasets for research.

Singular Value Decomposition
Comprehensive exploration of Singular Value Decomposition, covering mathematical foundations, applications in data processing, and implementation in MATLAB and Python for various real-world scenarios.

Qualitative Research
Comprehensive overview of qualitative research methods, covering literature reviews, semi-structured interviews, data analysis, and practical tips for effective research implementation.
ArcMap & ArcCatalog
This playlist discusses ArcMap and Geodatabase basics on ArcGis. You will also get to understand the difference between ArcMap and ArcGis Pro, Creating Grid Index in ArcMap, Georeferencing CAD Files in ArcMap and using Layer files in ArcMap and ArcGis Pr…
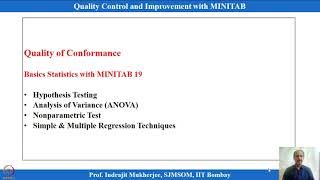
Quality Control and Improvement with MINITAB
This course will emphasize on application of different theories, tools, and techniques for Quality Control and Improvement. Most of the topics will be discussed with relevant problems and solutions in MINITAB 19 software interface.

Protein Annotations
Learn protein annotation techniques including molecular docking, function identification, structure analysis, and molecular dynamics simulations using tools like Autodock, Pymol, and Gromacs.
Biopython
Learn essential Biopython techniques for bioinformatics, including sequence analysis, NCBI database access, BLAST queries, and COVID-19 genome analysis. Practical tutorials with Python.

The Ultimate MS Excel Crash Course - Microsoft Excel 2016 Tutorial for Beginners
Comprehensive 6-hour tutorial covering Excel basics to advanced functions. Learn data entry, formatting, formulas, VLOOKUP, charts, and more. Includes hands-on exercises for practical skill development.

Incident Response with Fireeye - Final Hackersploit Blue Team Training
Learn to use FireEye's Redline for incident response, including memory and file analysis. Gain practical skills in data collection, comprehensive collection, and analysis sessions for effective threat assessment.

Microsoft Excel Course for Beginners
Comprehensive Excel tutorial covering basics to advanced features. Learn data manipulation, formulas, formatting, and practical applications for effective spreadsheet solutions.

Kalman Filter for Beginners - Recursive Filters & MATLAB Examples
Explore recursive filters, including average, moving average, and low-pass filters, with practical MATLAB examples. Learn the foundations of Kalman filtering for enhanced estimation and data analysis skills.
Working with LIDAR in ArcGIS
Companion Videos for the e-book, "Working with LIDAR in ArcGIS". The eBook is available on Amazon at http://tinyurl.com/hjbujgb for $2.99. These videos cover some of the hands-on exercises from the book as a supplement to the text.
Python for Bioinformatics - Beginner Level
Learn Python programming for bioinformatics, covering DNA sequence manipulation, data types, and analysis techniques. Ideal for beginners in biology and computational biology.
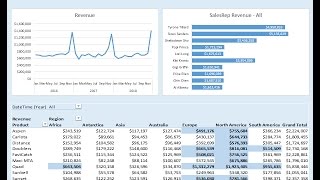
How to Build Excel Dashboard - PivotTable, Chart, Conditional Formatting
Learn to create an Excel dashboard using Power Query, PivotTables, charts, and DAX measures. Master data modeling, conditional formatting, and dynamic updates for effective data visualization and analysis.