Getting Started with Event-Driven Analytics
Explore event-driven analytics: understand events, their components, and best practices. Learn how to structure and implement events in various tools, and discover practical use cases for improved data insights.
First Look- Pivot Tables in Google Data Studio
Explore data visualization with pivot tables in Google Data Studio. Learn to create multi-dimensional tables, use row and column dimensions, add filters, and enhance your dashboarding capabilities.

Yandex Metrica - A Google Analytics Alternative
Explore Yandex Metrica as a potential Google Analytics alternative, comparing features like dashboards, bounce rate, goals, and session replay to help you make an informed decision.
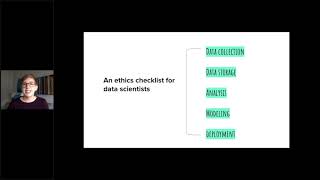
Actionable Ethics for Data Scientists - Emily Miller
Explore ethical considerations in data science, covering data collection, storage, analysis, and modeling. Learn practical strategies to address ethical challenges in your work.
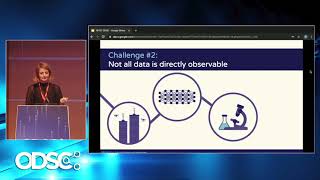
Making Robust Business Decisions with Sparse Data - Sarah Jarvis, PhD | ODSC Europe 2019
Explore data-efficient solutions for supply chain management, focusing on forecasting with limited data and making robust decisions in complex, dynamic systems.
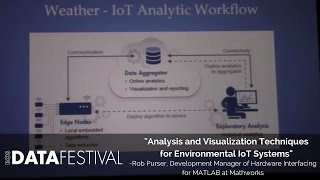
Analysis and Visualization Techniques for Environmental IoT Systems
Explore environmental IoT data analysis techniques, from edge node sensor analytics to historical and online data processing, with practical tools and visualizations for deeper insights.
Prepping Data for Analysis in R
Comprehensive workshop on data preparation for analysis in R, covering common issues, automated solutions, and practical demonstrations using open-source tools and packages.

Data Science Solutions with Cortana Analytics
Comprehensive tutorial on building predictive models using Microsoft Azure Machine Learning, covering data processing, model creation, deployment, and practical applications in various domains.
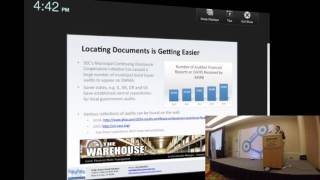
ODSC West 2015 - Marc Joffe "Collecting and Analyzing Open Local Government Data"
Explore efforts to collect, analyze, and share US local government data, enhancing democratic accountability through open platforms like GovWiki and key resources such as EMMA.
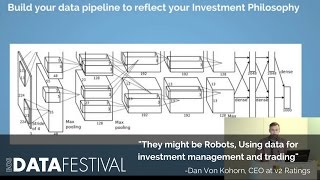
They Might Be Robots - Using Data for Investment Management and Trading
Explore data-driven investment strategies, from industry trends to machine learning techniques, for portfolio management and active trading in this insightful talk by Dan Von Kohorn.
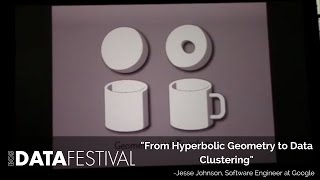
From Hyperbolic Geometry to Data Clustering
Explore how hyperbolic geometry and knot theory inspire innovative data clustering algorithms, bridging abstract mathematics with practical data science applications.
Power Query Group By - Complete Lesson with 10 Examples
Comprehensive tutorial on Power Query's Group By feature, covering basic to advanced applications with 10 practical examples for data analysis and calculations in Excel.

Forecasting with the FB Prophet Model
Learn to use Facebook's Prophet model for time series forecasting in Python, covering data preparation, model training, evaluation, and incorporating holiday effects.
Flight Delay Dataset Creation
Live coding session demonstrating the creation of a flight delay dataset using Python and Pandas. Learn data acquisition, cleaning, exploration, and visualization techniques with real-world airline data.
Complete Data Science Project
Explore Wordle tweet data through comprehensive EDA using Python, pandas, and matplotlib. Learn data wrangling, visualization techniques, and gain insights from a Kaggle Grandmaster's analysis.
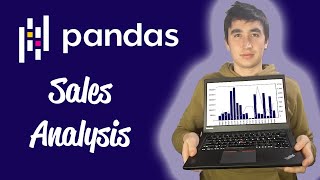
Solving Real World Data Science Tasks With Python Pandas
Analyze real-world sales data using Python Pandas and Matplotlib. Learn data cleaning, exploration, and visualization techniques to answer key business questions and gain valuable insights.

Does Instagram Think You Live in an Influential City? - A Deep Dive Into Web Data
Explore Instagram's city influence using a 40GB dataset. Learn data cleaning, ML algorithms, visualization, and dashboard creation for impactful business insights.
R for Data Scientists and Data Analysts
Master essential R skills for data analysis and science, covering variables, vectors, functions, and control structures in a comprehensive tutorial.
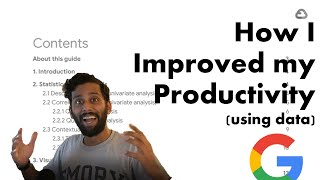
The Google Guide to Exploratory Data Analysis - With Code
Learn to apply Google's Exploratory Data Analysis guide using productivity data, covering data cleaning, visualization, and statistical techniques for insightful analysis and feature selection.
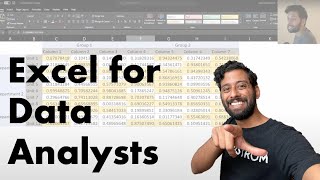
Beginner's Excel Tutorial - Data Science-Analysis and Beyond
Learn essential Excel skills for data analysis, including functions, lookups, formatting, and advanced features like pivot tables and macros. Gain practical knowledge for data-driven decision-making.
Exploratory Data Analysis
Learn techniques for extracting meaningful insights from new datasets through hands-on exploratory data analysis, covering data import, filtering, visualization, and advanced manipulation methods.