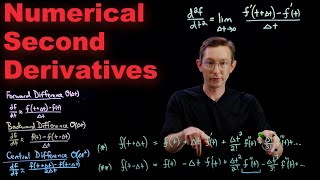
Numerical Differentiation - Second Derivatives and Differentiating Data
Explore numerical computation of second derivatives and data differentiation with Python and Matlab examples, covering finite difference schemes and practical applications.

Intermediate Microsoft Excel Tutorial - How to Use Power Pivot in Excel
Learn to use Power Pivot in Excel for advanced data analysis, creating relationships between tables, performing calculations, and building insightful reports with Pivot Tables, KPIs, and Pivot Charts.

Intermediate Microsoft Excel Tutorial - How to Use Power Query
Learn Power Query in Excel: Import, transform, and consolidate data efficiently. Master data cleaning, column manipulation, merging tables, and formula creation for streamlined data management.

Track Ethereum Transactions and Balance Using Python
Learn to track Ethereum transactions and balances using Python and the Etherscan API. Create graphs to visualize wallet data over time. Ideal for intermediate Python programmers interested in blockchain technology.
Learn NumPy in 30 Minutes
Master essential NumPy functions for efficient array operations, data manipulation, and numerical computing in Python. Covers basics to advanced topics like multidimensional arrays, broadcasting, and linear algebra.
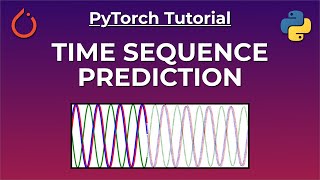
PyTorch Time Sequence Prediction With LSTM - Forecasting Tutorial
Learn to predict time sequences using PyTorch and LSTMs. Create sine waves, build an LSTM model, implement a training loop, and perform final testing for accurate forecasting.
Excel VBA Expert Tutorial
Master Excel VBA: Automate tasks, create custom functions, and build advanced tools. Learn foundational concepts and practical applications for enhanced productivity.

Excel VBA Advanced Tutorial
Comprehensive guide to advanced Excel VBA concepts, covering loops, variables, and complex functions. Ideal for business analysts and data scientists seeking to automate processes and expand Excel capabilities.

Excel Power User Advanced Tutorial
Advanced Excel techniques for power users: dynamic ranges, pivot table enhancements, web data import, and VBA macros. Develop skills to solve complex problems efficiently and push Excel's capabilities to new limits.

Excel Power User Beginner Tutorial
Master advanced Excel functions like VLOOKUP, INDEX-MATCH, and OFFSET. Learn data mining, dynamic ranges, and conditional formatting to solve complex problems efficiently and become a true Excel power user.

Excel 2016 Advanced Tutorial
Master advanced Excel techniques including named ranges, complex functions, data consolidation, solver tools, and macros to enhance your data analysis and productivity skills.

Excel 2016 Intermediate Tutorial
Comprehensive intermediate Excel tutorial covering advanced data manipulation, visualization, and analysis techniques. Learn to create pivot tables, charts, and use powerful features for efficient data management.
Mini Python Projects for Intermediates
Learn to build three intermediate Python projects: a shortest path finder, NBA stats tracker, and currency converter. Enhance your skills with practical coding examples and step-by-step guidance.

XLOOKUP Excel Tutorial
Master Excel's powerful XLOOKUP function for faster, more efficient data lookup. Learn its advantages over VLOOKUP and Index/Match, and explore advanced features like approximate matching and two-way searches.
Excel 2019 Expert Tutorial
Comprehensive tutorial covering advanced Excel features including named ranges, complex functions, data analysis tools, and macros. Ideal for users seeking to enhance productivity and data manipulation skills.

Excel 2019 Advanced Tutorial
Master advanced Excel 2019 features: data management, charts, pivot tables, and automation. Enhance efficiency in organizing, analyzing, and presenting complex data for professional spreadsheet mastery.
Excel 2019 Beginner Tutorial
Comprehensive tutorial covering Excel 2019 basics, from interface navigation to formulas, functions, data organization, and time-saving features for beginners and everyday users seeking efficiency.

Word Expert Tutorial
Comprehensive tutorial covering advanced Microsoft Word features, including forms, tracking changes, citations, macros, and PDF editing. Suitable for beginners and experienced users seeking to enhance productivity.
Power BI Master Tutorial
Comprehensive tutorial on Power BI, covering data querying, analysis, and visualization. Learn to build relationships, create dashboards, and master advanced functions for effective business analytics.

Power BI Advanced Tutorial
Master advanced Power BI techniques for data analysis and visualization. Learn to build queries, create relationships, use DAX functions, design interactive dashboards, and publish reports online.

Power BI Beginner Tutorial
Learn to process and visualize data using Microsoft's Power BI. Master querying, data prep, relationship building, and creating interactive dashboards and reports for effective business analytics.