
Power BI Beginner Tutorial
Learn to build queries, prep data, create relationships, and develop interactive dashboards using Microsoft's Power BI. Master essential functions for data analysis and visualization in this comprehensive tutorial.

Excel 2019 Power User Tutorial
Advanced Excel techniques for data analysis, including VLOOKUP troubleshooting, INDEX MATCH, PivotTables, array formulas, conditional formatting, charts, and macros. Ideal for power users seeking efficient problem-solving methods.

Google Sheets Beginner Tutorial
Master Google Sheets essentials: navigation, data entry, formulas, formatting, and advanced features. Gain practical skills for efficient spreadsheet creation, analysis, and sharing in this comprehensive tutorial.

Awesome Excel Tips and Tricks for 2023
Discover 30 essential Excel tips and tricks to boost productivity, from basic formatting to advanced functions, covering a wide range of features for beginners and intermediate users.

Visualizing Data and Building Dashboards in Excel & Power BI
Comprehensive guide to data visualization and dashboard creation in Excel and Power BI, covering various chart types, PivotTables, Power Query, and advanced techniques for effective data presentation.

PostgreSQL Tutorial Full Course
Comprehensive PostgreSQL tutorial covering database creation, data manipulation, advanced queries, functions, procedures, and more. Ideal for mastering Postgres from basics to advanced concepts.
Excel Array Formulas & Functions - 50 Examples of How to Become an Array Expert
Master Excel array formulas with 50 practical examples, covering fundamental concepts, advanced functions, and real-world applications for data analysis and reporting.

All Important Excel Lookup Formulas - Excel Worksheet, Power Query & DAX – 28 Examples
Comprehensive guide to Excel lookup formulas, covering XLOOKUP, FILTER, XMATCH, INDEX, and more. Includes examples in Excel, Power Query, and DAX for exact and approximate matches.

Logical Tests - Excel Formulas, Conditional Formatting, PivotTables, Power Query, and More
Master Excel's logical functions, formulas, and advanced features. Learn to create powerful data analysis tools using PivotTables, conditional formatting, and Power Query for efficient data management.
Data Analysis in Excel - Important Excel Skills for Data Analysts
Master essential Excel skills for data analysis, including cleaning functions, pivot tables, and data visualization techniques to enhance your analytical capabilities.

SAP HANA Cloud's Advanced Multi-Model Capabilities and Graph Processing - Challenge Winners and Expert Insights
Explore SAP HANA Cloud's graph capabilities, including GraphScript, table parameters, and the TRAVERSE DIJKSTRA operator. Learn from challenge winners and experts about advanced multi-model functionalities.
Calculation View Modeling in SAP Business Application Studio
Explore Calculation View modeling in SAP Business Application Studio, covering key features, HANA Cloud development concepts, and integration with SAP Analytics Cloud for efficient data preparation and analysis.
Excel 2021 Pivot Tables Tutorial
Master Excel Pivot Tables to efficiently analyze large datasets, create insightful reports, and design powerful charts. Learn data organization, custom sorting, and advanced Power Pivot features.
Excel 2021 XLOOKUP Tutorial
Discover XLOOKUP, Excel's powerful new lookup function. Learn its advantages over VLOOKUP and INDEX/MATCH, and master techniques for faster, more efficient data retrieval and analysis.
Excel 2021 Power User Tutorial
Master advanced Excel techniques for efficient data analysis, including XLOOKUP, pivot tables, array functions, and macros. Enhance problem-solving skills and streamline complex tasks for power users.
Excel 2021 - Intro to Data Analysis Tutorial
Learn essential Excel data analysis techniques: tables, conditional formatting, functions, charts, and pivot tables for effective data insights and visualization.

Excel 2021 Advanced Tutorial - Part 3 of 3
Master advanced Excel 2021 features: nested functions, database operations, XLOOKUP, UNIQUE, SORT, FILTER, LET, data consolidation, and an introduction to macros for enhanced productivity.

Excel 2021 Intermediate Tutorial - Part 2 of 3
Enhance data analysis skills with advanced Excel features: tables, pivot tables, data validation, conditional formatting, and more. Learn to visualize and protect your data effectively.
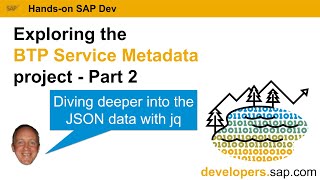
Exploring BTP Service Metadata - Deep Dive into Resource Files and JQ Filters
Dive deep into BTP Service Metadata project, exploring resource files and advanced jq filtering techniques. Learn about OData frontend, metadata structure, and JSON manipulation for SAP BTP services.
Exploring the BTP Service Metadata Project - Part 1
Dive into SAP BTP Service Metadata project, exploring JSON files, metadata structure, and practical examples using jq and ijq tools. Learn to extract and manipulate data for various use cases.

Tableau Desktop Tutorial - Beginner to Advanced Tableau Training
Comprehensive Tableau training covering basics to advanced topics, including data connections, visualizations, parameters, LOD expressions, geospatial charts, and table calculations for effective data analysis and interpretation.