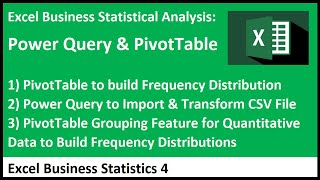
Excel Statistical Analysis - PivotTable & Power Query to Build Frequency Distributions
Master PivotTables and Power Query for creating frequency distributions from various data types. Learn efficient techniques for data import, transformation, and analysis in Excel.

Excel Data Analysis - Power Pivot, DAX Formulas, Relationships, Data Modeling & Much More
Master Power Pivot and DAX formulas for advanced Excel data analysis. Learn data modeling, relationships, and visualization techniques to create powerful reports and dashboards.
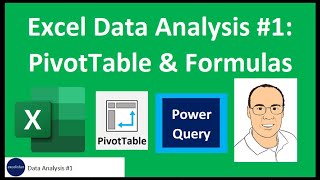
Excel Data Analysis - PivotTables, Power Query, Formulas and Charts
Learn essential Excel data analysis techniques using PivotTables, Power Query, formulas, and charts. Master importing data, creating reports, and visualizing trends for effective business insights.
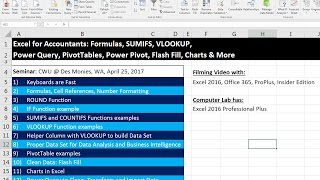
Excel for Accountants - PivotTables, Power Query, IF, SUMIFS, VLOOKUP, Flash Fill, Charts Seminar
Comprehensive Excel seminar for accountants covering essential functions, PivotTables, data analysis, and Power Query. Enhance your skills with practical examples and real-world applications.
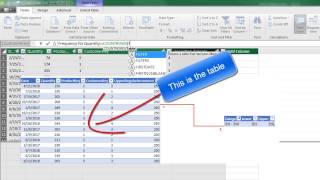
DAX Formulas for Running Total and % of Running Total & Other DAX Tricks
Master advanced DAX formulas for running totals, percentages, and data modeling in Excel. Learn to create relationships, use functions like CALCULATE and FILTER, and handle regular and irregular increments.
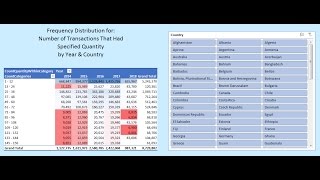
Data Model & DAX Formulas - Quantity Frequency Distribution by Year & Country
Learn to create a Data Model with DAX formulas for PivotTable frequency distributions, including conditional formatting and big data handling in Excel.

Extract Records With Multiple Contains - Partial Text Criteria: 4 Examples
Learn advanced Excel techniques for extracting records with multiple contains criteria, using array formulas, functions like SEARCH and MMULT, and exploring matrix multiplication concepts.
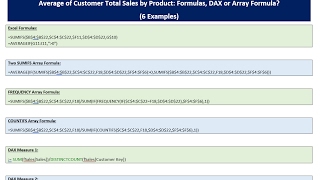
Average of Customer Total Sales by Product - Formulas, DAX or Array Formula?
Learn advanced Excel techniques for calculating average customer sales by product using formulas, array formulas, and DAX measures in Power Pivot. Compare methods and optimize performance.
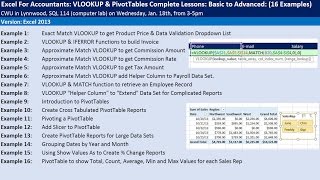
Excel for Accountants - VLOOKUP & PivotTables - Complete Lessons from Basic to Advanced
Comprehensive tutorial on VLOOKUP and PivotTables for accountants, covering basic to advanced techniques. Includes practical examples, efficiency tricks, and number formatting tips for Excel mastery.
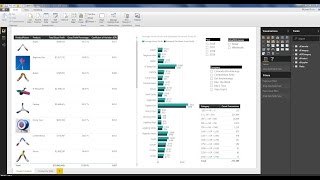
Power BI Desktop - Build Data Model, Get Data, DAX Formulas, Visualizations, Publish to Web
Comprehensive tutorial on building data models, creating DAX formulas, and designing visualizations in Power BI Desktop. Learn to import data, establish relationships, and publish interactive reports online.
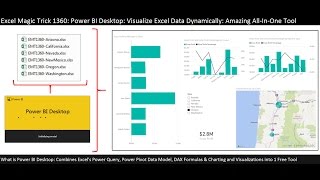
Comprehensive Power BI Desktop Example - Visualize Excel Data & Build Dynamic Dashboard
Learn to import, transform, and visualize Excel data in Power BI Desktop. Create dynamic dashboards with maps, charts, and slicers while mastering DAX calculations for insightful business analytics.
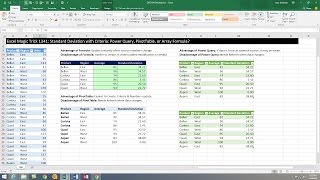
Standard Deviation with Criteria - Power Query, PivotTable, or Array Formula
Learn advanced Excel techniques for calculating standard deviation using Power Query, PivotTables, and array formulas. Master data analysis with practical examples and step-by-step guidance.

Import Multiple Excel Files & Sheets into Excel - Power Query Get & Transform
Learn to import and combine multiple Excel files and sheets using Power Query, create PivotTables, and automate data updates for efficient analysis and reporting.
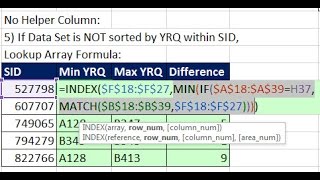
MIN & MAX Functions for Alphanumeric - Text Values Report
Learn 8 methods to find MIN and MAX alphanumeric values in Excel, including VLOOKUP, array formulas, AGGREGATE, MINIFS/MAXIFS, Power Query, and SQL, with practical examples and explanations.
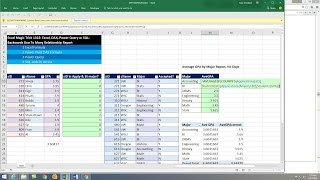
Backwards One to Many Relationship Report - Excel, Power Query or SQL?
Learn advanced Excel techniques for calculating average GPA across related tables using array formulas, DAX, Power Query, and SQL. Master data analysis skills for complex relationships.
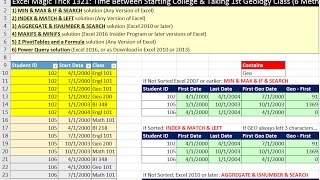
Time Between Starting College & Taking 1st Geology Class - 6 Methods
Learn six Excel methods to calculate time between starting college and taking first geology class, from basic functions to advanced Power Query solutions.
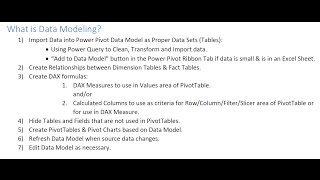
How to Build Data Model and DAX Formulas in Power Pivot
Master data modeling and DAX formulas in Power Pivot for Excel 2016. Learn to create relationships, calculated columns, and measures for powerful data analysis and visualization.
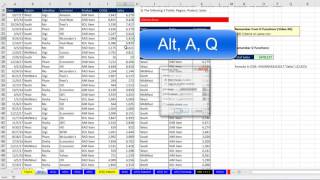
Transform Data Sets Using Advanced Filter - Excel 2016
Master Excel's Advanced Filter with 8 practical examples, from basic AND/OR criteria to complex formulas, unique lists, and professional report creation.
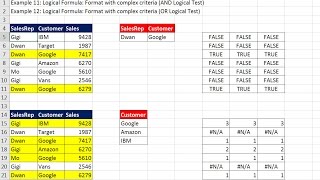
Conditional Formatting to Visualize Data - Built-in and Logical Formulas
Explore advanced Excel data visualization techniques using conditional formatting, including built-in features and logical formulas for effective data analysis and presentation.
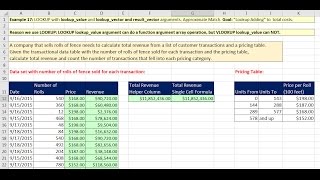
Lookup Functions and Formulas in Excel 2016 - Comprehensive Lessons with 20 Examples
Comprehensive tutorial on Excel lookup functions with 20 practical examples, covering VLOOKUP, HLOOKUP, INDEX, MATCH, and LOOKUP for data retrieval and analysis.
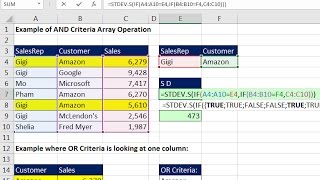
Conditional Calculations with Excel Formulas - Comprehensive Lessons
Comprehensive guide to conditional calculations in Excel, covering AND/OR functions, SUMIFS, array formulas, and more. Ideal for mastering complex data analysis techniques.