
Anomaly Detection on Streaming Data Using Azure Databricks
Learn to detect numerical anomalies in streaming data using Azure Databricks and Anomaly Detector. Build an end-to-end solution for monitoring applications with real-time anomaly detection capabilities.

New to Anomaly Detector: Multivariate Capabilities - AI Show Live Episode 11
Explore Anomaly Detector's new multivariate capabilities for detecting anomalies across multiple data streams. Learn about use cases, APIs, model training, and real-world applications in this informative session.
Fixing String Inconsistencies in PostgreSQL
Explore PostgreSQL's string handling features to improve data quality. Learn pattern matching, regular expressions, and advanced extensions for fixing inconsistencies and ensuring accurate results.

R Programming Crash Course
Comprehensive introduction to R programming, covering installation, data types, data manipulation with dplyr, visualization with ggplot2, and practical data analysis techniques for beginners.

Excel 2016 Tips, Tricks, Shortcuts, Functions & Formulas
Master Excel 2016 with 30 essential tips, tricks, shortcuts, functions, and formulas. Boost productivity and efficiency in data management, analysis, and visualization.

How to Use Formulas and Functions in Microsoft Excel
Learn essential Excel formulas and functions, from basic math to advanced techniques like VLOOKUP and conditional functions, enhancing your data analysis and productivity skills.

Python Pandas Tutorial - Grouping and Aggregating - Analyzing and Exploring Your Data
Learn to group and aggregate data in Python Pandas, exploring techniques like value counts, multiple aggregates, and practice questions to analyze datasets effectively and answer complex queries.
Covid 19 Data Analysis
Learn to analyze COVID-19 data using professional data science tools. Covers web scraping, data manipulation, and visualization techniques to extract insights from reliable sources.

Plotly Tutorial
Comprehensive tutorial on Plotly for data visualization, covering various chart types, styling options, and advanced features like 3D plots, maps, and animations.

Pandas Tutorial
Comprehensive guide to Pandas framework for data manipulation, analysis, and visualization, covering key concepts and practical examples for effective data science workflows.
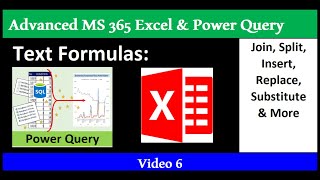
Text Formulas & Functions in Excel Worksheet and Power Query
Comprehensive tutorial on Excel text functions and Power Query, covering formulas, data extraction, error handling, and data cleaning techniques for efficient spreadsheet management.
Excel & Power BI Data Analysis Complete Class in One Video
Comprehensive guide to data analysis using Excel and Power BI, covering essential tools and techniques for importing, transforming, visualizing, and sharing data effectively.

Excel Worksheet Formulas & Models – Everything You Ever Wanted to Know
Comprehensive guide to Excel formulas, covering various types, editing modes, and practical applications through real-world models. Ideal for mastering advanced spreadsheet techniques.

Excel Formulas & Functions, PivotTables, Slicers & Charts
Comprehensive guide to Excel's powerful features: formulas, functions, PivotTables, charts, and data analysis tools. Master essential skills for efficient spreadsheet management and insightful data visualization.
Introduction to Microsoft 365 Excel and Conventions for Class
Learn essential Microsoft 365 Excel basics, including file management, interface navigation, keyboard shortcuts, formulas, and data alignment. Master fundamental concepts for efficient spreadsheet creation and analysis.
Excel Statistical Analysis - Learn Central Limit Theorem by Building Sampling Distribution of Xbar
Explore the Central Limit Theorem through practical Excel exercises, learning to build sampling distributions and apply statistical concepts for informed business decision-making.
Excel Statistical Analysis - Introduction to Probability, Power Query & Pivot Table Example
Aprenda os fundamentos de probabilidade em Excel, incluindo experimentos aleatórios, espaço amostral, combinações e permutações. Aplique conceitos em exemplos práticos de negócios usando Power Query e Tabelas Dinâmicas.
Excel Statistical Analysis - 5-Number Summary - Box & Whiskers Chart - Power Query & Array Formulas
Aprenda a criar análises estatísticas avançadas no Excel usando Power Query, fórmulas de matriz e gráficos Box & Whiskers para visualizar e interpretar conjuntos de dados complexos.
Excel Statistical Analysis - Range, Variance, Standard Deviation, Coefficient of Variation
Master Excel's statistical analysis tools for calculating range, variance, standard deviation, and coefficient of variation. Apply these measures to make informed business decisions and interpret financial data.
Excel Statistical Analysis - Cross Tabulation, Visualizations, and Logical Tests, Simpson’s Paradox
Master cross tabulation, visualizations, and logical tests in Excel. Learn to create insightful reports, understand Simpson's Paradox, and effectively analyze data relationships using PivotTables and charts.
Excel Statistical Analysis - Frequency Distributions & Visualizations for Categorical Data
Learn to create frequency distributions and visualize categorical data using Excel. Master PivotTables, column/bar charts, and advanced techniques for effective data presentation and analysis.