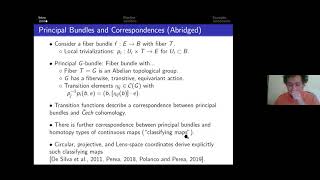
TALLEM - Topological Assembly of Locally Linear Euclidean Models
Explore a novel topological data analysis tool for nonlinear dimensionality reduction, assembling local Euclidean coordinates to create globally consistent maps that respect data topology.
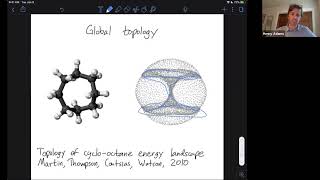
From Persistent Homology to Machine Learning
Overview of persistent homology's applications in machine learning, exploring its use in analyzing global topology and local geometry of datasets, with examples from various fields and discussions on stability and interpretability.
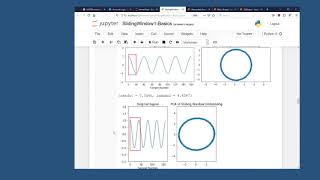
TDALabs - Some of TDA's Greatest Hits in Interactive Python
Interactive exploration of TDA's key applications using Python, covering time series analysis, image processing, 3D shape clustering, and more. Hands-on examples showcase TDA's versatility and practical uses.
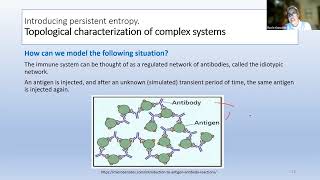
Persistent Entropy, a Tool for Topologically Summarizing Data
Explore persistent entropy as a tool for data summarization, covering its properties, stability, and diverse applications in emotion recognition, cell organization, and literary analysis.

Conversation on the Paper "Persistent Extension and Analogous Bars" by Yoon, Ghrist, Giusti
Explore persistent homology extensions and analogous bars in topological data analysis, discussing novel methods for comparing persistence barcodes and their applications in data science.
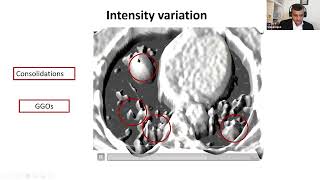
Classification of COVID-19 via Homology of CT-Scans
Explore topological data analysis for COVID-19 detection in CT scans, using persistent homology to quantify shape features and achieve high accuracy in classification.
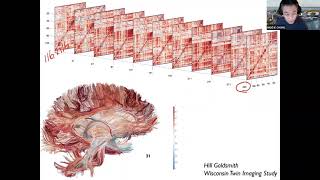
Topological Learning and Its Application to Multimodal Brain Network Integration
Explore topological learning for integrating multimodal brain networks, focusing on a novel framework using persistent homology and Wasserstein distance-based loss for efficient computations in neuroimaging studies.
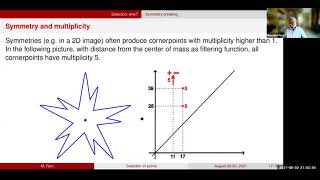
Massimo Ferri - Selection of Points in Persistence Diagrams
Explore point selection in persistence diagrams, including Kurlin's criterion and the Ziqqurat method, for noise reduction and improved data analysis in topological data analysis.
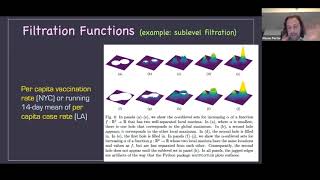
Mason Porter - Topological Data Analysis of Spatial Complex Systems
Explore topological data analysis in spatial systems, from spider webs to COVID-19 spread. Learn filtered simplicial complexes and their applications in various real-world scenarios.
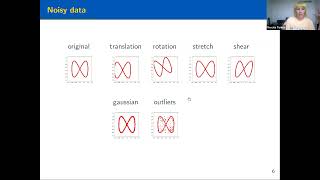
On the Effectiveness of Persistent Homology
Exploring persistent homology's effectiveness in shape analysis tasks, outperforming baselines in detecting holes, curvature, and convexity from point clouds, with robustness to limited resources and data transformations.

Data Storytelling in Action
Explore data storytelling with industry experts as they discuss visualization techniques, audience engagement, and emerging trends to effectively communicate insights across various fields.
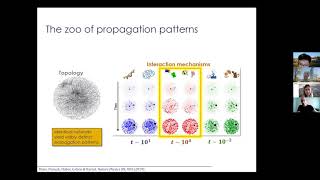
Network GPS - Navigating Network Dynamics
Explore network dynamics and learn to navigate complex systems using innovative techniques in this insightful webinar by Baruch Barzel from Bar-Ilan University.

Getting Started with Tableau Dashboard
Learn Tableau Dashboard fundamentals, including data visualization, architecture, and interactive features. Hands-on demonstrations cover installation, data types, and creating worksheets for effective business intelligence analysis.

IPL Data Analysis Using EDA - EDA Case Study - What Is EDA? - Great Learning
Practical guide to IPL data analysis using EDA, covering key concepts, techniques, and real-world applications in Python for extracting insights from cricket statistics.

Data Science Basics for Absolute Beginners
Comprehensive introduction to Data Science fundamentals, covering key components, job roles, and career prospects. Ideal for beginners seeking to enter this high-demand field.

Python for Data Science - Data Science Tutorial - Python Tutorial
Learn Python for data science: versatile programming, complex problem-solving, and real-world applications. Covers key concepts, tools, and techniques with hands-on examples and expert guidance.

IPL Data Analysis Using EDA - Exploratory Data Analysis Case Study
Practical guide to IPL data analysis using Python, covering EDA techniques, data preprocessing, and visualization to extract insights from real-world cricket datasets.

Kaggle Competition for Beginners - Kaggle Competition Explained - Beginners Guide - Great Learning
Learn to participate in Kaggle competitions: explore the platform, enroll in contests, and submit results. Ideal for data science enthusiasts looking to enhance their skills and engage with the community.
Exploratory Data Analysis Tutorial - Basics of EDA with Python
Learn Python-based exploratory data analysis techniques to uncover insights, detect patterns, and visualize relationships in datasets for informed decision-making and hypothesis testing.

Excel Basics for Beginners - MS Excel
Master Excel basics: formulas, data manipulation, and visualization. Learn essential skills for spreadsheet analysis and effective data presentation in this comprehensive beginner's guide.

Top 10 Indian Foods Analysis Using Python
Analyze top Indian foods using Python, covering data manipulation, visualization, and machine learning. Learn pandas, NumPy, Matplotlib, Seaborn, and scikit-learn for exploratory data analysis on Indian cuisine dataset.