Qualitative Research in Social Sciences
Explore diverse qualitative research methods in social sciences, from ethnography to autoethnography. Learn data collection, analysis techniques, and understand strengths and challenges of various approaches.

Experimental Physics - I
Comprehensive introduction to experimental physics, covering tools, apparatus, analysis techniques, and various experiments in mechanics, thermodynamics, and electromagnetism.

The Ultimate Excel Tutorial - Beginner to Advanced
Comprehensive Excel mastery: from basic formulas to advanced techniques like VBA macros, covering data cleaning, pivot tables, and dynamic arrays for enhanced productivity.
Excel Power Query - Power Query Tutorial for Beginners
Learn Power Query in Excel: import, transform, and combine data from multiple sources. Master essential techniques for efficient data analysis and manipulation.

Power BI Master Tutorial
Master data processing and visualization with Power BI. Learn to build queries, prep data, create relationships, and develop interactive dashboards. Gain skills in advanced analytics, AI visuals, and custom visualizations.
GPR Applications in Sedimentology
Explore ground-penetrating radar applications in sedimentology, from river beds to sand dunes, with high-resolution imaging of shallow stratigraphy across diverse environments.

Looking at Latino Families’ Access to ECE Through Multiple Dimensions
Explore Latino families' experiences with early care and education, including preferences, search behaviors, and access barriers. Gain insights for improving ECE policies and programs.
Planning Strategic Marketing Campaigns - Strategic Marketing
Learn data-driven strategies to develop effective marketing campaigns, set goals, and measure success. Gain insights for better decision-making and improved campaign outcomes.
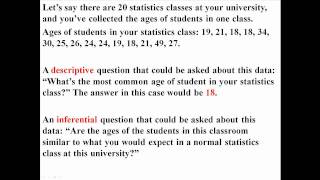
Statistics
Comprehensive exploration of statistical concepts, from basics to advanced topics, covering descriptive and inferential statistics, probability, distributions, hypothesis testing, and various statistical tests.
Data Visualization Using Tableau
Learn Tableau for powerful data visualization: from basics to advanced techniques, including dashboards, graphs, and real-world dataset analysis.

Engineering the Future of Medicine - The Turing Lectures
Explore cutting-edge machine learning applications in biomedical data interpretation, from cellular analysis to surgical skill assessment, with renowned engineer René Vidal.

ChatGPT Code Interpreter - S&P 500 Stock Market Price Prediction?
Explore ChatGPT's Advanced Data Analysis for S&P 500 stock price prediction, including data collection techniques and practical application of AI in financial forecasting.
Building Data Apps With a Codeless Approach - Build Data Apps Using KNIME Low-Code/No-Code
Learn to create interactive data apps using KNIME's low-code/no-code approach. Discover how to build, visualize, and deploy analytics solutions with user-friendly interfaces for end-users to gather insights effortlessly.

Overview of Text Mining and NLP Techniques - No-Code Approach KNIME Analytics - NLP Tutorial
Explore text mining and NLP techniques using KNIME Analytics Platform. Learn sentiment analysis, topic extraction, and build a real-time tweet analysis app in this no-code tutorial.
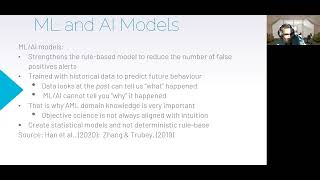
Using Machine Learning and AI to Automate Anti-Money Laundering Efforts
Explore innovative applications of ML and AI in automating anti-money laundering processes, enhancing detection and prevention strategies for financial institutions.
Deep Learning and Diabetic Retinopathy by Rajiv Raman
Explore deep learning applications in diabetic retinopathy detection, enhancing early diagnosis and treatment of this sight-threatening condition through advanced image analysis techniques.
Artificial Intelligence in OBGYN Ultrasound by Suresh Seshadri
Explore AI applications in OBGYN ultrasound imaging, focusing on advanced techniques for improved diagnosis and patient care in obstetrics and gynecology.
How to Analyze Data in Excel Spreadsheets
Learn essential Excel skills for data analysis: data entry, formatting, formulas, functions, and referencing. Practical exercises included for hands-on experience in spreadsheet manipulation and analysis.

Excel Beginner Tutorial - From Basics to Advanced Features
Comprehensive tutorial covering Excel basics to advanced features, including formulas, functions, data management, charts, and automation techniques for improved efficiency and data analysis skills.

Power BI Examples, Demos & Tutorials
You asked for it. Here is a complete and in-depth course on how to use Power BI for data analysis.
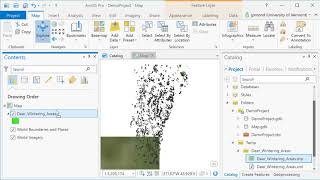
ArcGIS Pro
ArcGIS Pro is desktop GIS software developed by Esri, which replaces their ArcMap software generation. Learn the basics of using ArcGIS such a spatial joins, selections of attributes and layers, raster processing and topograpic analysis in this tutorial…