Crafting and Leveraging Prometheus Metrics for Infrastructure Intelligence
Explore Prometheus metrics for data-driven infrastructure decisions. Learn query-building, tools, and data warehouse concepts to maximize insights from your system's metrics.
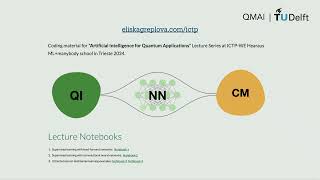
Machine Learning for Quantum Applications - Part 2
Explore advanced machine learning techniques for quantum applications, focusing on cutting-edge developments and practical implementations in quantum systems.
Quality Improvement Cycle: Study for Substance Use Disorders
Analyze and interpret data collected during the "Do" phase of the Quality Improvement Cycle for substance use disorder treatment.
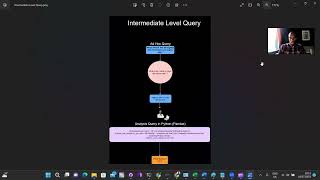
Putting an AI-Powered Data Analyst to the Test
Evaluate an AI-powered analyst prototype across beginner to advanced analytics queries, showcasing its capabilities in data analysis and interpretation.

Embeddings vs Fine-Tuning - Part 3: Unsupervised Fine-Tuning
Explore unsupervised fine-tuning techniques for embeddings, including dataset cleanup, Google Colab implementation, and expert tips for optimal results.
VMS: Interactive Visualization to Support the Sensemaking and Selection of Predictive Models
Explore interactive visualization for comparing and selecting predictive models, integrating performance, instance, and feature-level analysis to support informed decision-making in machine learning.

Neural Graph Databases: Combining GNNs with Labeled Property Graphs
Explore neural graph databases, combining graph databases with graph neural networks using LPG2vec encoder for improved prediction accuracy in complex graph datasets.
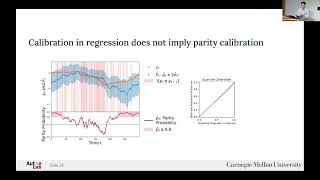
Parity Calibration in Sequential Regression - Forecasting Increase-Decrease Events
Explore parity calibration in sequential regression, focusing on predicting increase-decrease events rather than exact values. Learn its applications in epidemiology, weather forecasting, and nuclear fusion control.

ME3255: Loading Data into Pandas and Boolean Indexing - Lecture 1
Learn to load data into Pandas, perform boolean indexing, and explore unique operations and color maps in this concise tutorial on data manipulation techniques.

Using, Reading, and Improving ChatGPT Integration Methods - ME3255
Explore advanced ChatGPT integration techniques to enhance usage, comprehension, and optimization for improved AI-powered solutions.
Survivorship Bias - Understanding the Hidden Fallacy in Success Stories
Explore the concept of survivorship bias and its impact on decision-making through real-world examples and insights from a passionate educator.
Creating PivotTables and PivotCharts Dashboards with Slicers in Excel
Learn to create interactive Excel dashboards using PivotTables, PivotCharts, and Slicers. Master data visualization techniques, customize slicer appearance, and integrate timeline slicers for date-based filtering.
Google Ads Reports in Google Analytics - Standard, Exploration and Advertising
Explore Google Ads reporting in Analytics: standard reports, custom explorations, and advertising insights. Learn to link accounts and analyze campaign performance effectively.
Julia's Use in Nuclear Physics Data Analysis: A Case Study
Explore Julia's potential in nuclear physics data analysis, combining high performance with dynamic capabilities for efficient processing and visualization of large datasets.

The Personalisation of Cardiovascular Models Using Julia
Innovative workflow for personalizing cardiovascular models using Julia, combining data assimilation, sensitivity analysis, and optimization to enhance clinical decision-making and improve patient outcomes.
NetSurvival.jl - A Glimpse into Relative Survival Analysis
Explore relative survival analysis in cancer studies using NetSurvival.jl, a Julia package offering fast, reliable tools for extracting net survival curves and integrating with StatsModels.jl API.
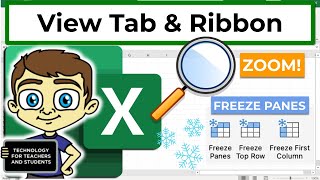
Excel View Tab and Ribbon in Depth
Explore Excel's View tab features like zoom, freeze panes, and Page Break Preview to enhance productivity and streamline your workflow in this comprehensive tutorial.
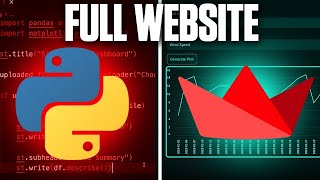
Build a Python Website in 15 Minutes with Streamlit
Learn to create interactive Python websites rapidly using Streamlit. Build data dashboards and user interfaces effortlessly in this hands-on tutorial for beginners and experienced developers alike.

How to Use VLOOKUP in Google Sheets - Beginner's Tutorial
Master VLOOKUP in Google Sheets: Find and match data efficiently. Step-by-step examples cover basics to advanced techniques, including multiple criteria and error handling.

LibreOffice - A Powerful Open Source Alternative to Microsoft Office
Explore LibreOffice: a powerful, free alternative to Microsoft Office. Learn installation, features, customization, and collaborative editing in this comprehensive overview.

Excel 365 for Beginners - Navigating Workbooks and Ribbons - Lecture 5
Learn to navigate Excel 365's interface, create workbooks, and understand key elements like ribbons, tabs, and toolbars. Master the basics of Excel's structure for efficient spreadsheet management.