Running Total in Column - Power Query, DAX or Worksheet Formula?
Learn to create running totals in Excel using worksheet formulas, Power Query, and DAX. Master expandable ranges and cumulative calculations for overall and monthly totals.
Two Fact Tables - DAX, Power Query or Worksheet Formulas to Convert to 1 Fact Table
Learn techniques to convert two fact tables into one using Excel formulas, DAX in Power Pivot, and Power Query in Power BI. Master data modeling and analysis skills for improved business reporting and decision-making.
Power Pivot - Big Data, Data Modeling, DAX & Dashboards
Aprenda a modelar dados, criar fórmulas DAX e construir dashboards usando Power Pivot. Importe dados SQL, crie tabelas de datas e explore recursos avançados para análise de negócios eficiente no Excel.
Data Modeling - VLOOKUP, Power Query or Power Pivot?
Learn data modeling techniques using VLOOKUP, Power Query, and Power Pivot for efficient data analysis in Excel. Explore methods for handling multiple tables and creating effective PivotTable reports.
The Magic of Power Query to Import, Transform & Load Data
Learn to import, clean, and transform data using Power Query in Excel. Master techniques for efficient data handling, report creation, and automated updates.
Visualizing Data with Tables, Charts, Conditional Formatting & Dashboards
Learn to create effective data visualizations in Excel using tables, charts, conditional formatting, and dashboards. Master techniques for clear, impactful data presentation and analysis.
PivotTables & Slicers - Create Dashboards & Summary Reports
Master PivotTables, Slicers, and dashboards in Excel. Create cross-tab reports, frequency distributions, and custom calculations for effective data analysis and visualization.
Excel Spreadsheet Formulas - Old School or Dynamic Arrays?
Learn to use Excel formulas for data analysis, comparing traditional methods with dynamic arrays. Master SUMIFS, COUNTIFS, and AVERAGEIFS for creating effective summary reports.
Comprehensive Introduction to Excel Power Pivot, DAX Formulas and DAX Functions
Comprehensive guide to Excel Power Pivot, DAX formulas, and functions. Learn data modeling, building relationships, and creating advanced calculations for powerful business intelligence dashboards.
Mysteries of VLOOKUP Function Revealed - Amazing Examples
Comprehensive tutorial on VLOOKUP function in Excel, covering 15 examples from basic to advanced usage, including exact and approximate matches, dynamic tables, and error handling.
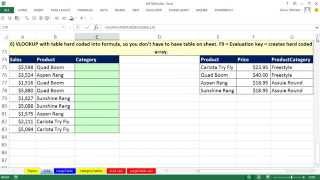
IF or VLOOKUP Function for Assigning Categories with Excel Formula - 8 Examples
Learn advanced Excel techniques for assigning categories using IF and VLOOKUP functions. Master data organization, formula creation, and efficient lookup methods for various scenarios.

Aging Accounts Receivable Reports on Multiple Sheets With Array Formula
Learn to create automated Aging Accounts Receivable Reports using Excel's array formulas, table features, and structured references. Master advanced functions like COUNTIFS, AGGREGATE, and INDEX for efficient data extraction and reporting.
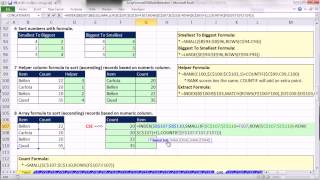
Ctrl - Shift - Enter- Excel Array Formulas - Extract Unique Lists & Sorting Formulas
Learn advanced Excel techniques for extracting unique lists, sorting data, and creating efficient array formulas to solve complex data analysis problems and enhance spreadsheet functionality.
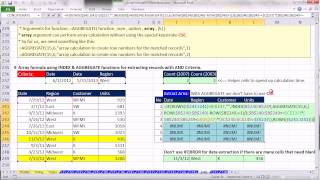
Ctrl - Shift - Enter- Excel Array Formulas - Formulas to Extract Records With Criteria
Master advanced Excel array formulas for efficient data extraction, including AND/OR criteria, INDEX, SMALL, and AGGREGATE functions. Optimize spreadsheet performance with practical examples and timing comparisons.
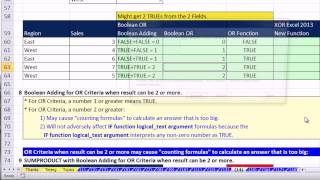
Ctrl - Shift - Enter - Excel Array Formulas - Boolean Logic, AND & OR Criteria, Convert TRUE FALSE
Aprenda a usar fórmulas de matriz avançadas no Excel, incluindo lógica booleana, critérios AND e OR, e conversão de TRUE/FALSE para análise de dados eficiente.
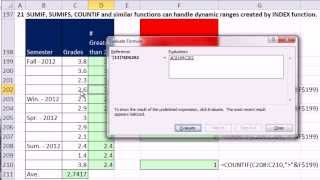
Ctrl - Shift - Enter - Excel Array Formulas - Dynamic Ranges - INDEX & OFFSET Functions
Master Excel's dynamic ranges using INDEX and OFFSET functions. Learn to create flexible formulas, charts, and data validation lists that automatically adjust as data changes, enhancing efficiency and accuracy in data analysis.
Ctrl + Shift + Enter - Excel Array Formulas - SUMPRODUCT Function - Including Timing
Comprehensive guide to SUMPRODUCT function in Excel, covering 21 examples with array formulas, timing comparisons, and efficient calculation techniques for data analysis and problem-solving.
Ctrl - Shift - Enter - Excel Array Formulas - Review Formula Basics
Comprehensive tutorial on Excel array formulas, covering formula basics, advanced functions, and practical applications for efficient data analysis and problem-solving.

Excel for Accounting - Formulas, VLOOKUP & INDEX, PivotTables, Recorded Macros, Charts, Keyboards
Master Excel for accounting with advanced formulas, PivotTables, macros, and charts. Learn efficient techniques for data analysis, reporting, and visualization to enhance your financial workflow.
INDEX & MATCH Lookup Functions - Beginning to Advanced
Comprehensive tutorial on INDEX & MATCH functions in Excel, covering 18 advanced techniques from basic lookups to complex array formulas for data extraction and manipulation.

Hack Data Model, Date Table & DAX Measures Without Buying Power Pivot
Master advanced Excel techniques: build data models, create DAX measures, and use functions like CALCULATE and TOTALYTD. Learn to optimize PivotTables and implement variables for efficient data analysis.