Excel Data Analysis Basics Class - Data Analysis & BI Made Easy with Excel Power Tools
Learn Excel data analysis using Power Tools: formulas, PivotTables, Power Query, Power Pivot, and Power BI. Create reports, dashboards, and visualizations for effective business decision-making with real-world datasets.
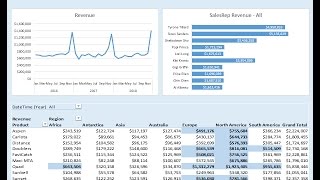
How to Build Excel Dashboard - PivotTable, Chart, Conditional Formatting
Learn to create an Excel dashboard using Power Query, PivotTables, charts, and DAX measures. Master data modeling, conditional formatting, and dynamic updates for effective data visualization and analysis.
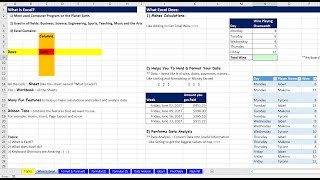
The Magic of Excel - Formulas, PivotTables, Charts, Flash Fill, Sort, Filtering, Functions & More
Discover Excel's powerful features: formulas, PivotTables, charts, and more. Learn essential skills to boost efficiency and data analysis capabilities for work, school, and personal projects.
Excel & Power BI Data Analysis Complete Class in One Video
Comprehensive guide to data analysis using Excel and Power BI, covering essential tools and techniques for importing, transforming, visualizing, and sharing data effectively.

Excel Formulas & Functions, PivotTables, Slicers & Charts
Comprehensive guide to Excel's powerful features: formulas, functions, PivotTables, charts, and data analysis tools. Master essential skills for efficient spreadsheet management and insightful data visualization.
Excel Statistical Analysis - Introduction to Probability, Power Query & Pivot Table Example
Aprenda os fundamentos de probabilidade em Excel, incluindo experimentos aleatórios, espaço amostral, combinações e permutações. Aplique conceitos em exemplos práticos de negócios usando Power Query e Tabelas Dinâmicas.
Excel Statistical Analysis - Cross Tabulation, Visualizations, and Logical Tests, Simpson’s Paradox
Master cross tabulation, visualizations, and logical tests in Excel. Learn to create insightful reports, understand Simpson's Paradox, and effectively analyze data relationships using PivotTables and charts.
Excel Statistical Analysis - Frequency Distributions & Visualizations for Categorical Data
Learn to create frequency distributions and visualize categorical data using Excel. Master PivotTables, column/bar charts, and advanced techniques for effective data presentation and analysis.
Excel Statistical Analysis - PivotTable & Power Query to Build Frequency Distributions
Master PivotTables and Power Query for creating frequency distributions from various data types. Learn efficient techniques for data import, transformation, and analysis in Excel.
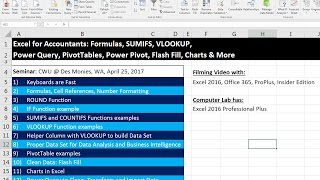
Excel for Accountants - PivotTables, Power Query, IF, SUMIFS, VLOOKUP, Flash Fill, Charts Seminar
Comprehensive Excel seminar for accountants covering essential functions, PivotTables, data analysis, and Power Query. Enhance your skills with practical examples and real-world applications.
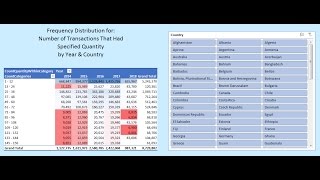
Data Model & DAX Formulas - Quantity Frequency Distribution by Year & Country
Learn to create a Data Model with DAX formulas for PivotTable frequency distributions, including conditional formatting and big data handling in Excel.
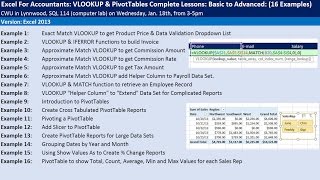
Excel for Accountants - VLOOKUP & PivotTables - Complete Lessons from Basic to Advanced
Comprehensive tutorial on VLOOKUP and PivotTables for accountants, covering basic to advanced techniques. Includes practical examples, efficiency tricks, and number formatting tips for Excel mastery.
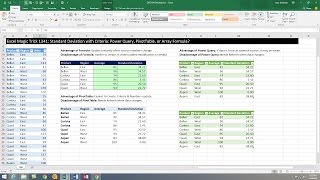
Standard Deviation with Criteria - Power Query, PivotTable, or Array Formula
Learn advanced Excel techniques for calculating standard deviation using Power Query, PivotTables, and array formulas. Master data analysis with practical examples and step-by-step guidance.

Import Multiple Excel Files & Sheets into Excel - Power Query Get & Transform
Learn to import and combine multiple Excel files and sheets using Power Query, create PivotTables, and automate data updates for efficient analysis and reporting.
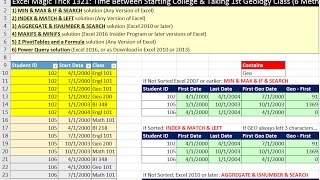
Time Between Starting College & Taking 1st Geology Class - 6 Methods
Learn six Excel methods to calculate time between starting college and taking first geology class, from basic functions to advanced Power Query solutions.
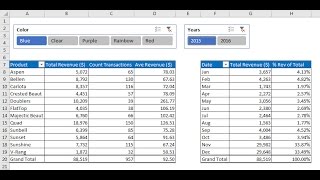
Data Analysis Fundamentals - PivotTables, Power Query & Data Model
Master Excel data analysis with PivotTables, Power Query, and Data Model. Learn sorting, filtering, and advanced techniques to handle large datasets efficiently and create insightful reports.
Basic Excel Business Analytics - Comprehensive PowerPivot, Data Model, DAX & Reporting Example
Comprehensive guide to PowerPivot: Import big data, build data models, create DAX measures, and generate insightful reports. Master advanced Excel analytics for business intelligence.
Two Fact Tables - DAX, Power Query or Worksheet Formulas to Convert to 1 Fact Table
Learn techniques to convert two fact tables into one using Excel formulas, DAX in Power Pivot, and Power Query in Power BI. Master data modeling and analysis skills for improved business reporting and decision-making.
Power Pivot - Big Data, Data Modeling, DAX & Dashboards
Aprenda a modelar dados, criar fórmulas DAX e construir dashboards usando Power Pivot. Importe dados SQL, crie tabelas de datas e explore recursos avançados para análise de negócios eficiente no Excel.
The Magic of Power Query to Import, Transform & Load Data
Learn to import, clean, and transform data using Power Query in Excel. Master techniques for efficient data handling, report creation, and automated updates.
Visualizing Data with Tables, Charts, Conditional Formatting & Dashboards
Learn to create effective data visualizations in Excel using tables, charts, conditional formatting, and dashboards. Master techniques for clear, impactful data presentation and analysis.