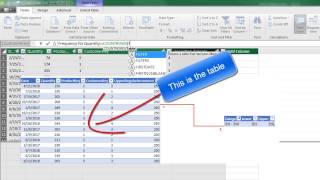
DAX Formulas for Running Total and % of Running Total & Other DAX Tricks
Master advanced DAX formulas for running totals, percentages, and data modeling in Excel. Learn to create relationships, use functions like CALCULATE and FILTER, and handle regular and irregular increments.
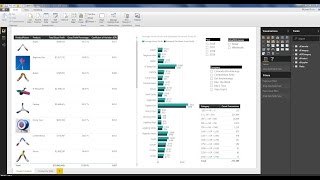
Power BI Desktop - Build Data Model, Get Data, DAX Formulas, Visualizations, Publish to Web
Comprehensive tutorial on building data models, creating DAX formulas, and designing visualizations in Power BI Desktop. Learn to import data, establish relationships, and publish interactive reports online.
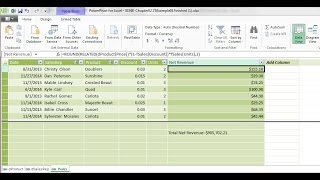
Basic Excel Business Analytics - Introduction to PowerPivot & Data Modeling
Comprehensive introduction to PowerPivot and data modeling in Excel, covering key concepts, DAX functions, and best practices for building efficient and effective data models for business analytics.
Power BI - Quick Project - Data Model
Explore data modeling in Power BI: create calculated columns, measures, and visuals to transform raw data into meaningful insights and interactive reports.

Fundamentals of DAX in Power BI & Power Pivot
Comprehensive tutorial on DAX fundamentals for Power BI and Power Pivot, covering key concepts, functions, and advanced techniques to enhance data analysis and reporting skills.
DAX Fundamentals in Power BI and Power Pivot - 2.5 Hour Course
Comprehensive tutorial on DAX fundamentals in Power BI, covering calculated columns, measures, context, functions, and advanced techniques for efficient data analysis and reporting.

Understanding Numeric Calculations in DAX
Explore DAX's numeric calculations, learning to differentiate between filter and row contexts, and when to use calculated columns versus measures for optimal data analysis and visualization.
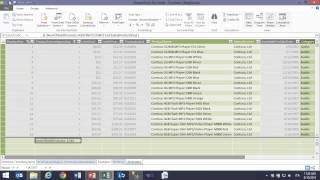
DAX Formulas in Action
Explore DAX formulas for BI solutions in Excel and SQL Server. Learn to create calculated columns, measures, and effective PivotTable analysis through hands-on demonstrations.
The Fundamentals of DAX Contexts
Embark on an African Safari-themed adventure to master DAX contexts, exploring row and filter contexts through captivating wildlife visuals. Gain essential skills for data analysis and business intelligence.