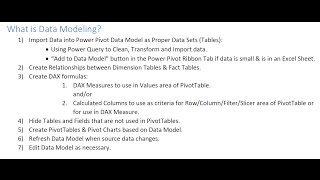
How to Build Data Model and DAX Formulas in Power Pivot
Master data modeling and DAX formulas in Power Pivot for Excel 2016. Learn to create relationships, calculated columns, and measures for powerful data analysis and visualization.

Create Microsoft Excel Pivot Charts and Map Charts
Learn to create and format Pivot Charts and Map Charts in Excel 2021/365. Master data visualization techniques, explore chart types, and practice with downloadable exercise files.

Intermediate Microsoft Excel Tutorial - How to Use Power Pivot in Excel
Learn to use Power Pivot in Excel for advanced data analysis, creating relationships between tables, performing calculations, and building insightful reports with Pivot Tables, KPIs, and Pivot Charts.
Excel 2019 Pivot Tables Tutorial
Master Excel's Pivot Tables to analyze large datasets efficiently. Learn creation, modification, and advanced features like Power Pivot for data modeling and DAX expressions.

Excel Pivot Tables Tutorial - From Basics to Advanced Techniques
Master Excel Pivot Tables: Analyze complex data, create insightful charts, and leverage advanced features like Power Pivot and DAX expressions for powerful data manipulation and visualization.

30 Essential Excel Tips and Tricks for Productivity - 2024 Tutorial
Comprehensive Excel tutorial covering 30 essential tips and tricks, from basic functions to advanced data visualization techniques, enhancing productivity and efficiency for users of all levels.

Visualizing Data - The Good, the Bad, and the Ugly
Explore effective data visualization techniques, from time series to deviations, using Excel, Power BI, and other tools. Learn to create impactful charts and avoid common pitfalls in data presentation.
Creating and Customizing Pivot Charts in Excel - From Data Preparation to Advanced Filtering
Master the creation and customization of pivot charts in Excel to transform complex data into dynamic visualizations. Learn data formatting, chart manipulation, and filtering techniques for effective data analysis.

Creating and Formatting Charts in Microsoft Excel - A Complete Tutorial
Master data visualization techniques in Excel through hands-on practice with charts, from basic line and pie charts to advanced pivot charts and sparklines, including formatting and design tips.