Excel Data Analysis Basics Class - Data Analysis & BI Made Easy with Excel Power Tools
Learn Excel data analysis using Power Tools: formulas, PivotTables, Power Query, Power Pivot, and Power BI. Create reports, dashboards, and visualizations for effective business decision-making with real-world datasets.

Excel Power Query - Power Query Tutorial for Beginners
Learn Power Query in Excel: import, transform, and combine data from multiple sources. Master essential techniques for efficient data analysis and manipulation.
Excel & Power BI Data Analysis Complete Class in One Video
Comprehensive guide to data analysis using Excel and Power BI, covering essential tools and techniques for importing, transforming, visualizing, and sharing data effectively.

Excel Data Analysis - Power Pivot, DAX Formulas, Relationships, Data Modeling & Much More
Master Power Pivot and DAX formulas for advanced Excel data analysis. Learn data modeling, relationships, and visualization techniques to create powerful reports and dashboards.
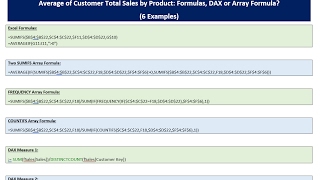
Average of Customer Total Sales by Product - Formulas, DAX or Array Formula?
Learn advanced Excel techniques for calculating average customer sales by product using formulas, array formulas, and DAX measures in Power Pivot. Compare methods and optimize performance.
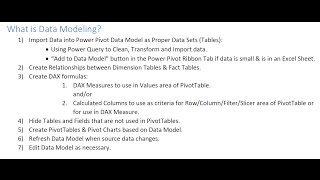
How to Build Data Model and DAX Formulas in Power Pivot
Master data modeling and DAX formulas in Power Pivot for Excel 2016. Learn to create relationships, calculated columns, and measures for powerful data analysis and visualization.
Running Total in Column - Power Query, DAX or Worksheet Formula?
Learn to create running totals in Excel using worksheet formulas, Power Query, and DAX. Master expandable ranges and cumulative calculations for overall and monthly totals.
Data Modeling - VLOOKUP, Power Query or Power Pivot?
Learn data modeling techniques using VLOOKUP, Power Query, and Power Pivot for efficient data analysis in Excel. Explore methods for handling multiple tables and creating effective PivotTable reports.
Excel 2021 Pivot Tables Tutorial
Master Excel Pivot Tables to efficiently analyze large datasets, create insightful reports, and design powerful charts. Learn data organization, custom sorting, and advanced functions like XLOOKUP and Power Pivot.

Power BI Expert Tutorial
Comprehensive tutorial on data visualization, from creating reports and dashboards to implementing accessibility features and real-time data streaming in Microsoft's business analytics platform.

Power BI Advanced Tutorial
Advanced Power BI techniques for data analysis and visualization, covering calculated tables, DAX functions, performance optimization, and creating interactive dashboards for effective business intelligence.
Power BI Beginner Tutorial
Learn to build queries, prep data, create relationships, and develop interactive dashboards using Microsoft's Power BI. Master essential functions for data analysis and visualization in this comprehensive tutorial.
Excel 2021 Pivot Tables Tutorial
Master Excel Pivot Tables to efficiently analyze large datasets, create insightful reports, and design powerful charts. Learn data organization, custom sorting, and advanced Power Pivot features.

Intermediate Microsoft Excel Tutorial - How to Use Power Pivot in Excel
Learn to use Power Pivot in Excel for advanced data analysis, creating relationships between tables, performing calculations, and building insightful reports with Pivot Tables, KPIs, and Pivot Charts.

Power BI Advanced Tutorial
Master advanced Power BI techniques for data analysis and visualization. Learn to build queries, create relationships, use DAX functions, design interactive dashboards, and publish reports online.

Power BI Beginner Tutorial
Learn to process and visualize data using Microsoft's Power BI. Master querying, data prep, relationship building, and creating interactive dashboards and reports for effective business analytics.
Excel 2019 Pivot Tables Tutorial
Master Excel's Pivot Tables to analyze large datasets efficiently. Learn creation, modification, and advanced features like Power Pivot for data modeling and DAX expressions.

Fundamentals of DAX in Power BI & Power Pivot
Comprehensive tutorial on DAX fundamentals for Power BI and Power Pivot, covering key concepts, functions, and advanced techniques to enhance data analysis and reporting skills.

Excel Pivot Tables Tutorial - From Basics to Advanced Techniques
Master Excel Pivot Tables: Analyze complex data, create insightful charts, and leverage advanced features like Power Pivot and DAX expressions for powerful data manipulation and visualization.
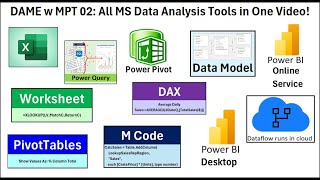
Microsoft Data Analysis Tools: Excel, Power Query, Power BI, Dataflow, DAX and M Code
Comprehensive tutorial on Microsoft data analysis tools, covering Excel, Power Query, Power BI, and more. Learn formulas, data modeling, and visualization techniques for effective data analysis.

Excel Data Analysis Full Course Tutorial
Comprehensive tutorial covering advanced Excel features for data analysis, including Pivot Tables, XLOOKUP, Copilot integration, VBA, and macros. Master powerful tools to enhance your data manipulation skills.