
Google Sheets Tutorial for Beginners 2024 - Step-by-Step
Master Google Sheets essentials: create spreadsheets, import data, format cells, use functions, apply filters, visualize data, and collaborate effectively in this comprehensive beginner's guide.

Excel Shortcuts for Beginners - Essential Tips to Boost Productivity
Master essential Excel shortcuts to boost productivity and streamline your workflow. Learn navigation, data manipulation, formatting, and advanced features for efficient spreadsheet management.

How to Build and Design Charts and Dashboards in Excel
Master Excel data cleaning, custom formatting, and chart creation to transform raw information into visually impactful dashboards and presentations.

Apache Airflow
Comprehensive tutorials on Apache Airflow covering DAGs, operators, Kubernetes Executors, Docker, AWS integration, and more. Ideal for mastering workflow automation and orchestration.

Pivot Table in Excel
Learn to create, customize, and utilize Pivot Tables in Excel for efficient data summarization and analysis. Master various tools and techniques for powerful data insights.

Excel Skills
Enhance data analysis skills with time-series plots, matrix-to-vector conversion, vlookup, histograms, text data import, and correlation techniques in Excel.

LaTeX Tutorials
Master LaTeX for stunning math documents: equations, tables, figures, theorems, and graphics. From beginner to advanced, covering thesis writing and essential packages.
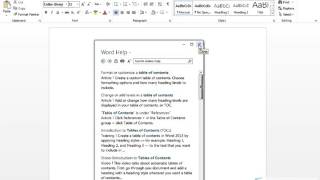
Learn Microsoft Word
Master Microsoft Word essentials: document creation, formatting, tables, images, and advanced features. Enhance productivity with practical skills for efficient word processing and document management.

Excel 2016 Tips, Tricks, Shortcuts, Functions & Formulas
Master Excel 2016 with 30 essential tips, tricks, shortcuts, functions, and formulas. Boost productivity and efficiency in data management, analysis, and visualization.

How to Use Formulas and Functions in Microsoft Excel
Learn essential Excel formulas and functions, from basic math to advanced techniques like VLOOKUP and conditional functions, enhancing your data analysis and productivity skills.
Text Formulas & Functions in Excel Worksheet and Power Query
Comprehensive tutorial on Excel text functions and Power Query, covering formulas, data extraction, error handling, and data cleaning techniques for efficient spreadsheet management.
Excel & Power BI Data Analysis Complete Class in One Video
Comprehensive guide to data analysis using Excel and Power BI, covering essential tools and techniques for importing, transforming, visualizing, and sharing data effectively.

Excel Formulas & Functions, PivotTables, Slicers & Charts
Comprehensive guide to Excel's powerful features: formulas, functions, PivotTables, charts, and data analysis tools. Master essential skills for efficient spreadsheet management and insightful data visualization.
Excel Statistical Analysis - Learn Central Limit Theorem by Building Sampling Distribution of Xbar
Explore the Central Limit Theorem through practical Excel exercises, learning to build sampling distributions and apply statistical concepts for informed business decision-making.
Excel Statistical Analysis - Introduction to Probability, Power Query & Pivot Table Example
Aprenda os fundamentos de probabilidade em Excel, incluindo experimentos aleatórios, espaço amostral, combinações e permutações. Aplique conceitos em exemplos práticos de negócios usando Power Query e Tabelas Dinâmicas.
Excel Statistical Analysis - 5-Number Summary - Box & Whiskers Chart - Power Query & Array Formulas
Aprenda a criar análises estatísticas avançadas no Excel usando Power Query, fórmulas de matriz e gráficos Box & Whiskers para visualizar e interpretar conjuntos de dados complexos.
Excel Statistical Analysis - Cross Tabulation, Visualizations, and Logical Tests, Simpson’s Paradox
Master cross tabulation, visualizations, and logical tests in Excel. Learn to create insightful reports, understand Simpson's Paradox, and effectively analyze data relationships using PivotTables and charts.
Excel Statistical Analysis - Frequency Distributions & Visualizations for Categorical Data
Learn to create frequency distributions and visualize categorical data using Excel. Master PivotTables, column/bar charts, and advanced techniques for effective data presentation and analysis.
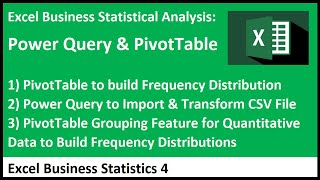
Excel Statistical Analysis - PivotTable & Power Query to Build Frequency Distributions
Master PivotTables and Power Query for creating frequency distributions from various data types. Learn efficient techniques for data import, transformation, and analysis in Excel.

Excel Data Analysis - Power Pivot, DAX Formulas, Relationships, Data Modeling & Much More
Master Power Pivot and DAX formulas for advanced Excel data analysis. Learn data modeling, relationships, and visualization techniques to create powerful reports and dashboards.
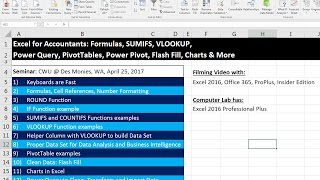
Excel for Accountants - PivotTables, Power Query, IF, SUMIFS, VLOOKUP, Flash Fill, Charts Seminar
Comprehensive Excel seminar for accountants covering essential functions, PivotTables, data analysis, and Power Query. Enhance your skills with practical examples and real-world applications.