Intro to Plotly Express - Complex Interactive Charts with One Line of Python Code
Create interactive data visualizations, including the Gapminder Animation, using Plotly Express in Python with minimal code. Learn to build and enhance plots step-by-step for effective storytelling.

Effortless Data Analysis and Cleaning with Data Wrangler in VS Code
Explore Data Wrangler in VS Code: Boost productivity with code-centric data cleaning, automated Pandas code generation, and insightful visualizations for efficient data analysis.

Python for Data Science
Comprehensive guide to mastering Numpy, Pandas, and Plotly for data science in Python. Covers core concepts and practical applications with free, commented code files for hands-on learning.
Financial Analyst App - GPT-4, Streamlit, and Llama-Index Tutorial
Build a financial news app UI with Streamlit, integrating GPT-4 and Llama-Index for advanced analysis and user-friendly interaction. Learn to create a powerful tool for financial insights.
Data Visualization in Python - Altair Scales, Axes, and Legends - Lecture 4
Master Altair's scales, axes, and legends for effective data visualization in Python. Learn to customize charts, enhance readability, and extract insights using advanced techniques and color encoding.
Data Visualization in Python - Altair Data Preparation Techniques
Explore data preparation techniques in Altair for effective visualization, including aggregation, binning, time unit transforms, and filtering to shape and analyze your data effectively.
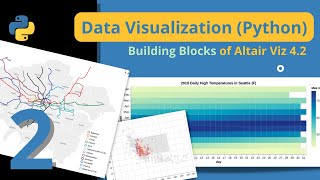
Data Visualization in Python - Building Blocks of Altair - Tutorial Series Part 2
Explore Altair's fundamental components for data visualization in Python, including data types, graphical marks, and visual encoding channels. Learn to create interactive and customizable charts.
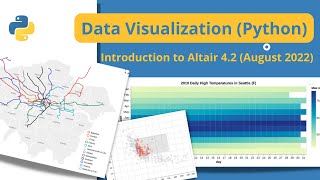
Data Visualization in Python - Altair 4.2 Tutorial
Comprehensive tutorial on Altair for data visualization in Python, covering setup, basic plots, customization, interactivity, and advanced features. Ideal for beginners and intermediate users.
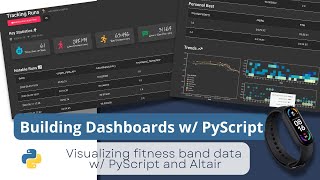
Building Dashboards with PyScript and Altair - Part 1
Learn to build interactive dashboards using PyScript, Altair, and Pandas. Create visually appealing data visualizations from fitness tracker data with step-by-step guidance on data processing and chart customization.
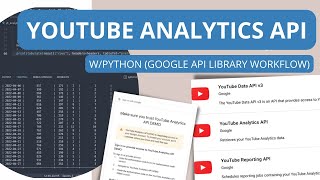
YouTube Analytics and Data API with Python - May 2022 Update
Learn to use YouTube Analytics and Data APIs with Python, covering setup, authentication, data retrieval, and creating CLI tables. Gain practical skills for working with Google's latest API libraries.
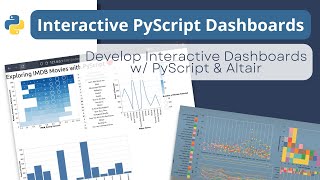
Building an Interactive Dashboard with PyScript and Altair - Tutorial 3
Learn to create an interactive dashboard using PyScript and Altair, from setup to deployment. Covers importing dependencies, building visualizations, and deploying the final product on GitHub Pages.

Accessing Elements of NDArray in NumPy - Python Programming
Learn to access elements in NumPy ndarrays, from basic indexing to multi-dimensional array manipulation, enhancing your Python data handling skills.

The Companies We Keep - In Search of "Shady" Corporate Activity
Explore the world's first network graph mapping UK corporate ownership data, built to uncover potential corrupt practices and improve transparency in business structures.
Relational Observability for Cloud-Native Security and Data Science
Explore SysFlow, a runtime observability framework for cloud-native security. Learn about its telemetry format, behavioral graphs, and tools for collecting and processing data in Kubernetes environments.
Simplifying Testing of Spark Applications
Learn techniques to simplify testing Spark applications, covering Python UDFs, Pandas UDFs, and functional APIs. Explore practical scenarios and demos for efficient data processing and analysis.
Deploy a Customer Churn Prediction Model with Streamlit and Docker
Learn to build and deploy a customer churn prediction model using Streamlit and Docker. Discover how to package machine learning models into interactive applications for effective customer retention strategies.
Building Robust Streaming Data Pipelines with Apache Spark
Learn to build robust streaming data pipelines using Apache Spark, Kafka, and Camel. Explore ETL challenges, data management, and lessons from running these technologies in Docker.
Spotlight on Emerging Data Science Workspaces and Spark as Development Levers
Explore how developers leverage Apache Spark and collaborative workspaces to build machine learning solutions, revolutionizing data applications and digital innovation.
Evidently AI Tutorial - Open Source ML Models Monitoring and Observability
Learn to monitor and evaluate ML models with Evidently AI, an open-source Python library for data scientists. Explore reports, test suites, and dashboards for continuous model quality assessment.
How to Forecast Sales Using Prophet and Python
Learn to build accurate sales forecasts using Prophet and Python in just 15 lines of code. Discover how to leverage this powerful tool for various time series predictions, from market trends to weather forecasting.
Coding Up a Linear Regression Algorithm From Scratch - Build Linear Regression From Python
Advanced Python tutorial on implementing Linear Regression from scratch, covering object-oriented programming, vectorized operations, and efficient coding strategies. Bridges theory and practice for experienced data scientists.