
Data Driven Maps With Python Folium & Leaflet.js
Learn to create interactive maps using Python Folium and Leaflet.js. Covers markers, geojson overlays, choropleths, and data integration for powerful data-driven visualizations.
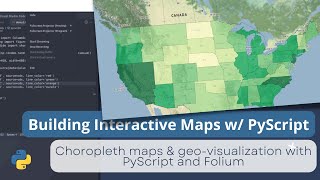
Building an Interactive Map with Folium and PyScript - Tutorial 5
Learn to create interactive maps using PyScript and Folium. Build choropleth visualizations for Indonesia and US unemployment data, then deploy your project on GitHub Pages.
Processing Geodata Using Python and Open Source Modules
Learn to analyze, manipulate, and visualize geospatial data using Python and open-source modules like Shapely, Fiona, rasterio, and GeoPandas. Explore vector and raster data handling, spatial reference systems, and map creation.
Interactive Mapmaking with Python
Explore interactive mapmaking using Python and GeoDataframes. Learn to create visually appealing maps with libraries like Folium, Kepler.gl, and Plotly, and discover Geopatra for simplified geodata visualization.